
The console
The console ships inside AgentPrism.UI as a pre-built, Brotli-compressed
single-page application. There is no node_modules in your project and no JavaScript
build in your pipeline.
builder.AddAgentPrism()       .UseOpenAI(apiKey)       .UseUI();
app.MapAgentPrism("/agentprism");
There is no separate mapping call. MapAgentPrism finds the registration and binds
the console under the same prefix, so the prefix is written once.
Dashboard
Section titled “Dashboard”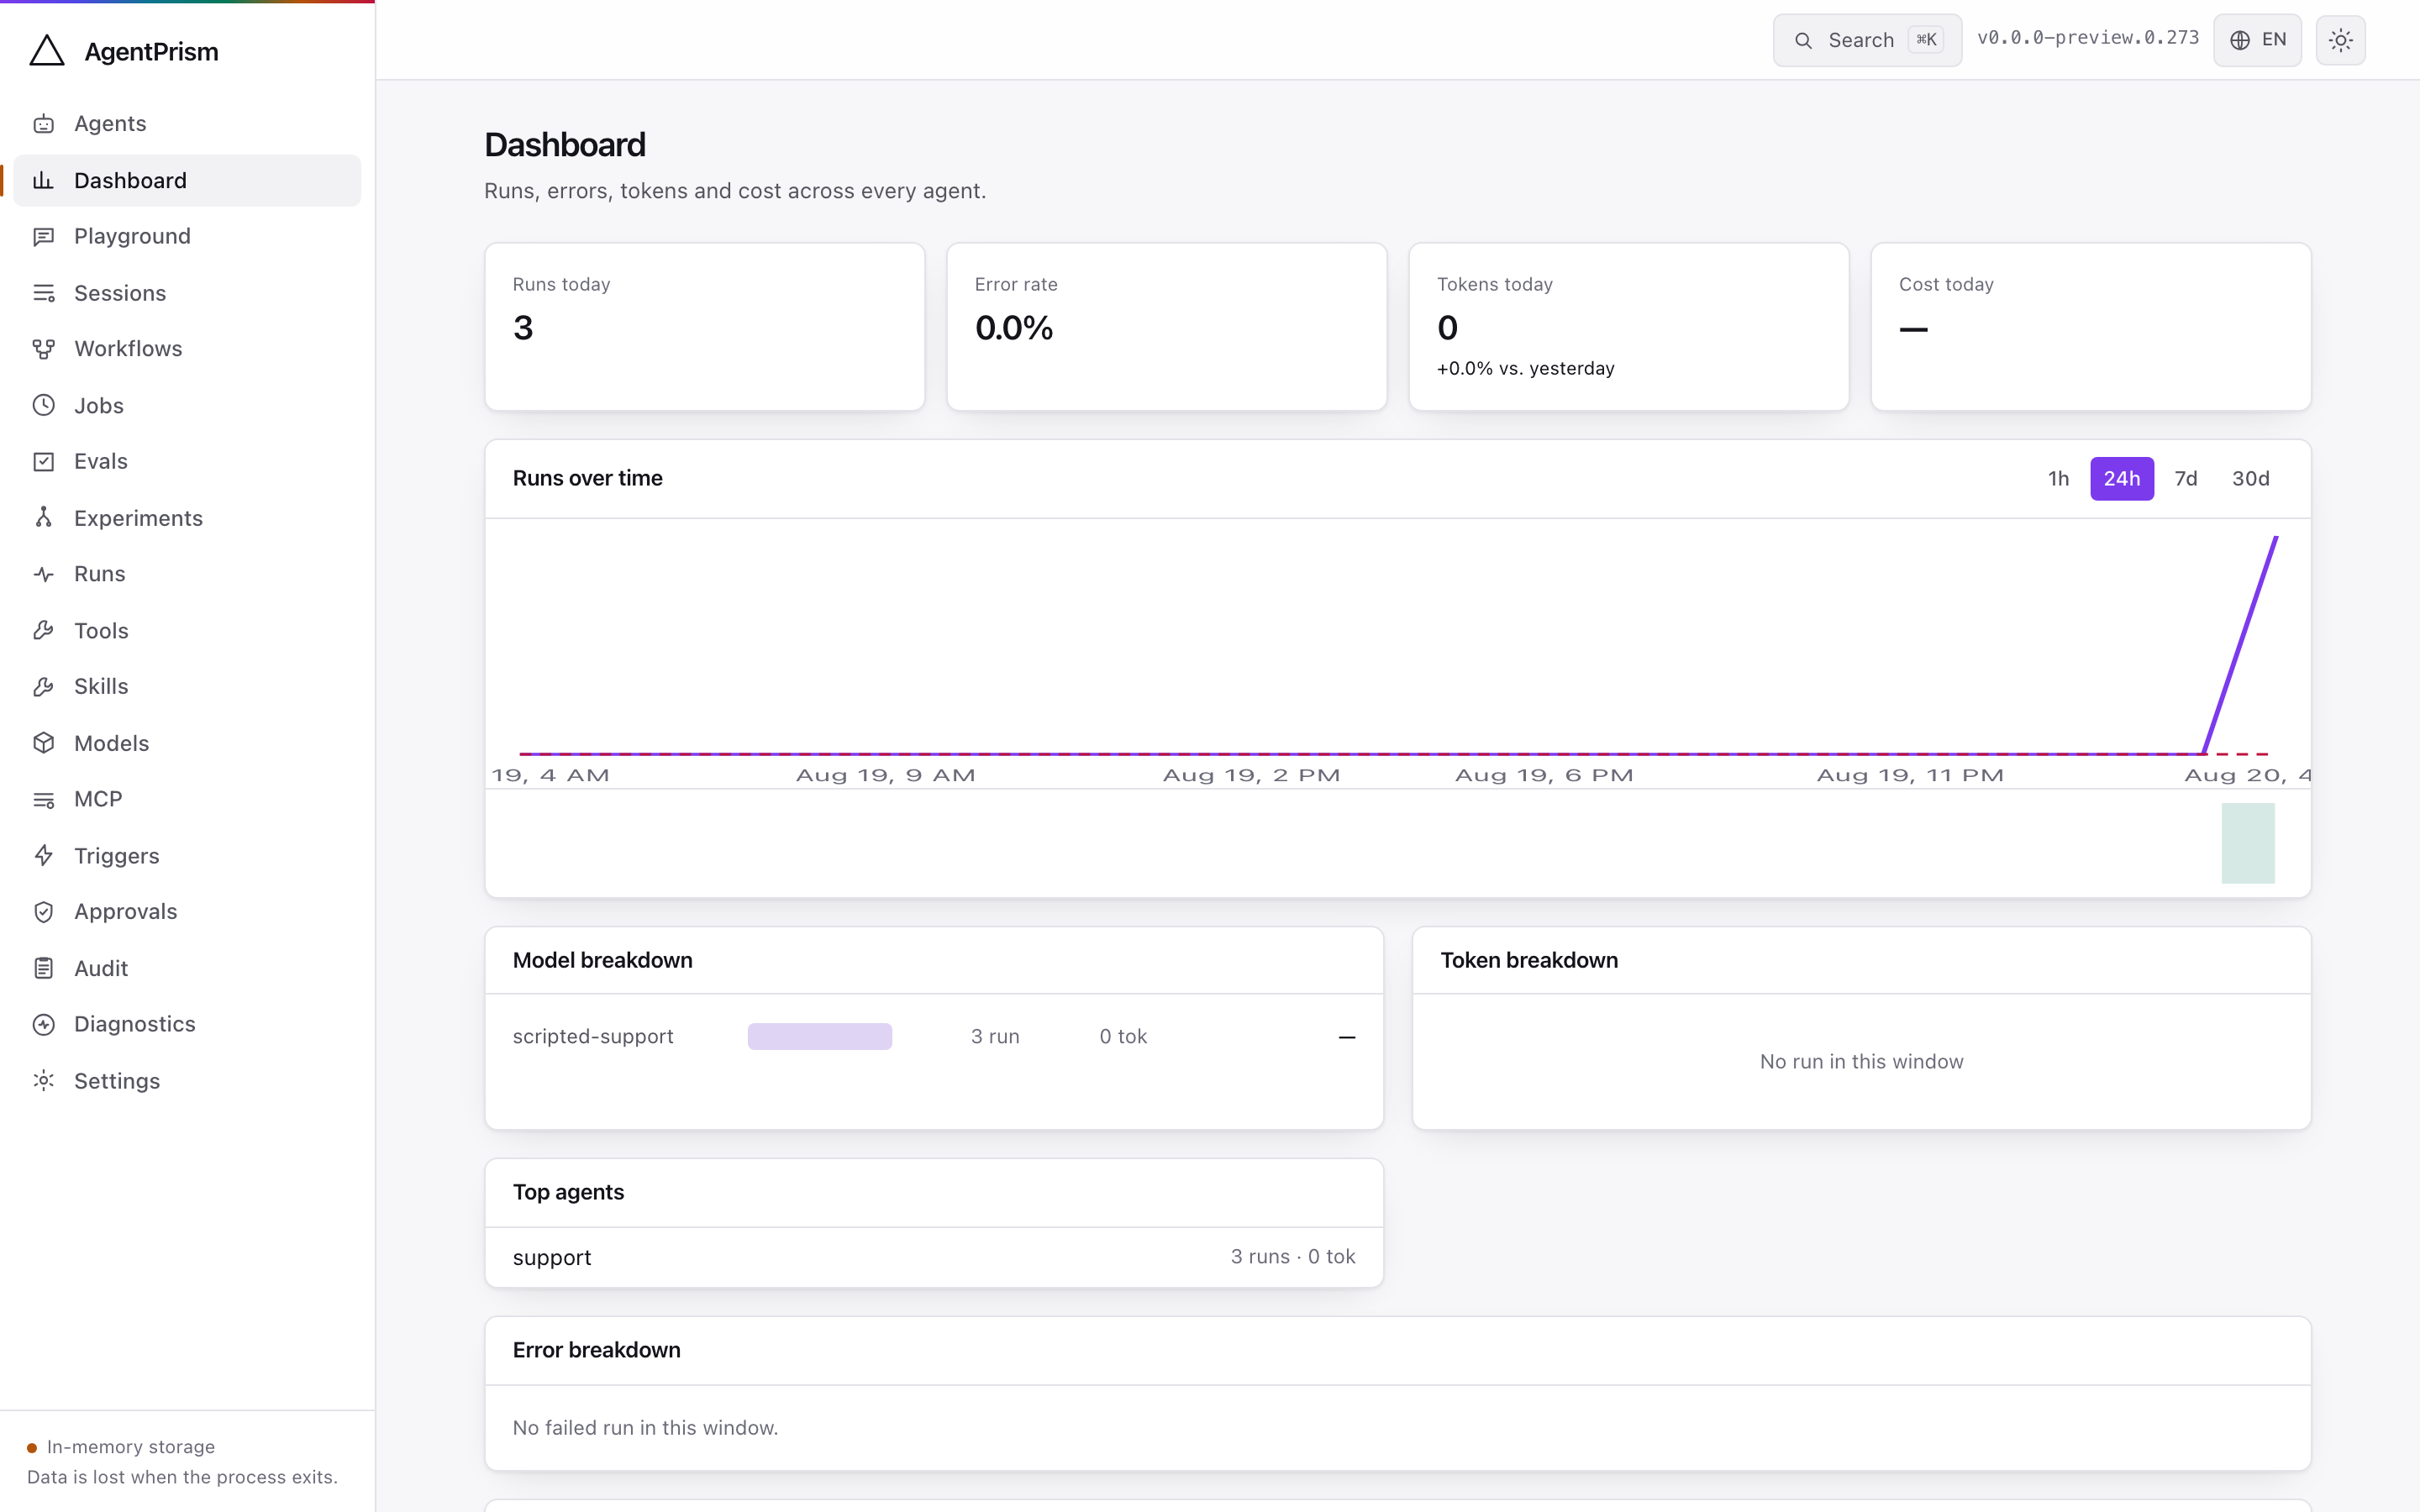
Runs, errors, tokens, and cost across every agent, over a window you choose. Cost appears only when pricing is configured; models with no pricing are counted separately rather than silently written as zero.
A token breakdown bar shows where the tokens actually went: prompt-cache hits, fresh input, reasoning, and plain output. The four slices are disjoint — cache hits and reasoning are re-cut out of the input and output totals rather than added beside them, so the bar is never longer than the tokens that were spent. Each slice is named with its own count underneath, so colour is never the only signal.
The footer always states which storage is active. In the screenshot above it says in-memory — a reminder that this data ends with the process.
Agents
Section titled “Agents”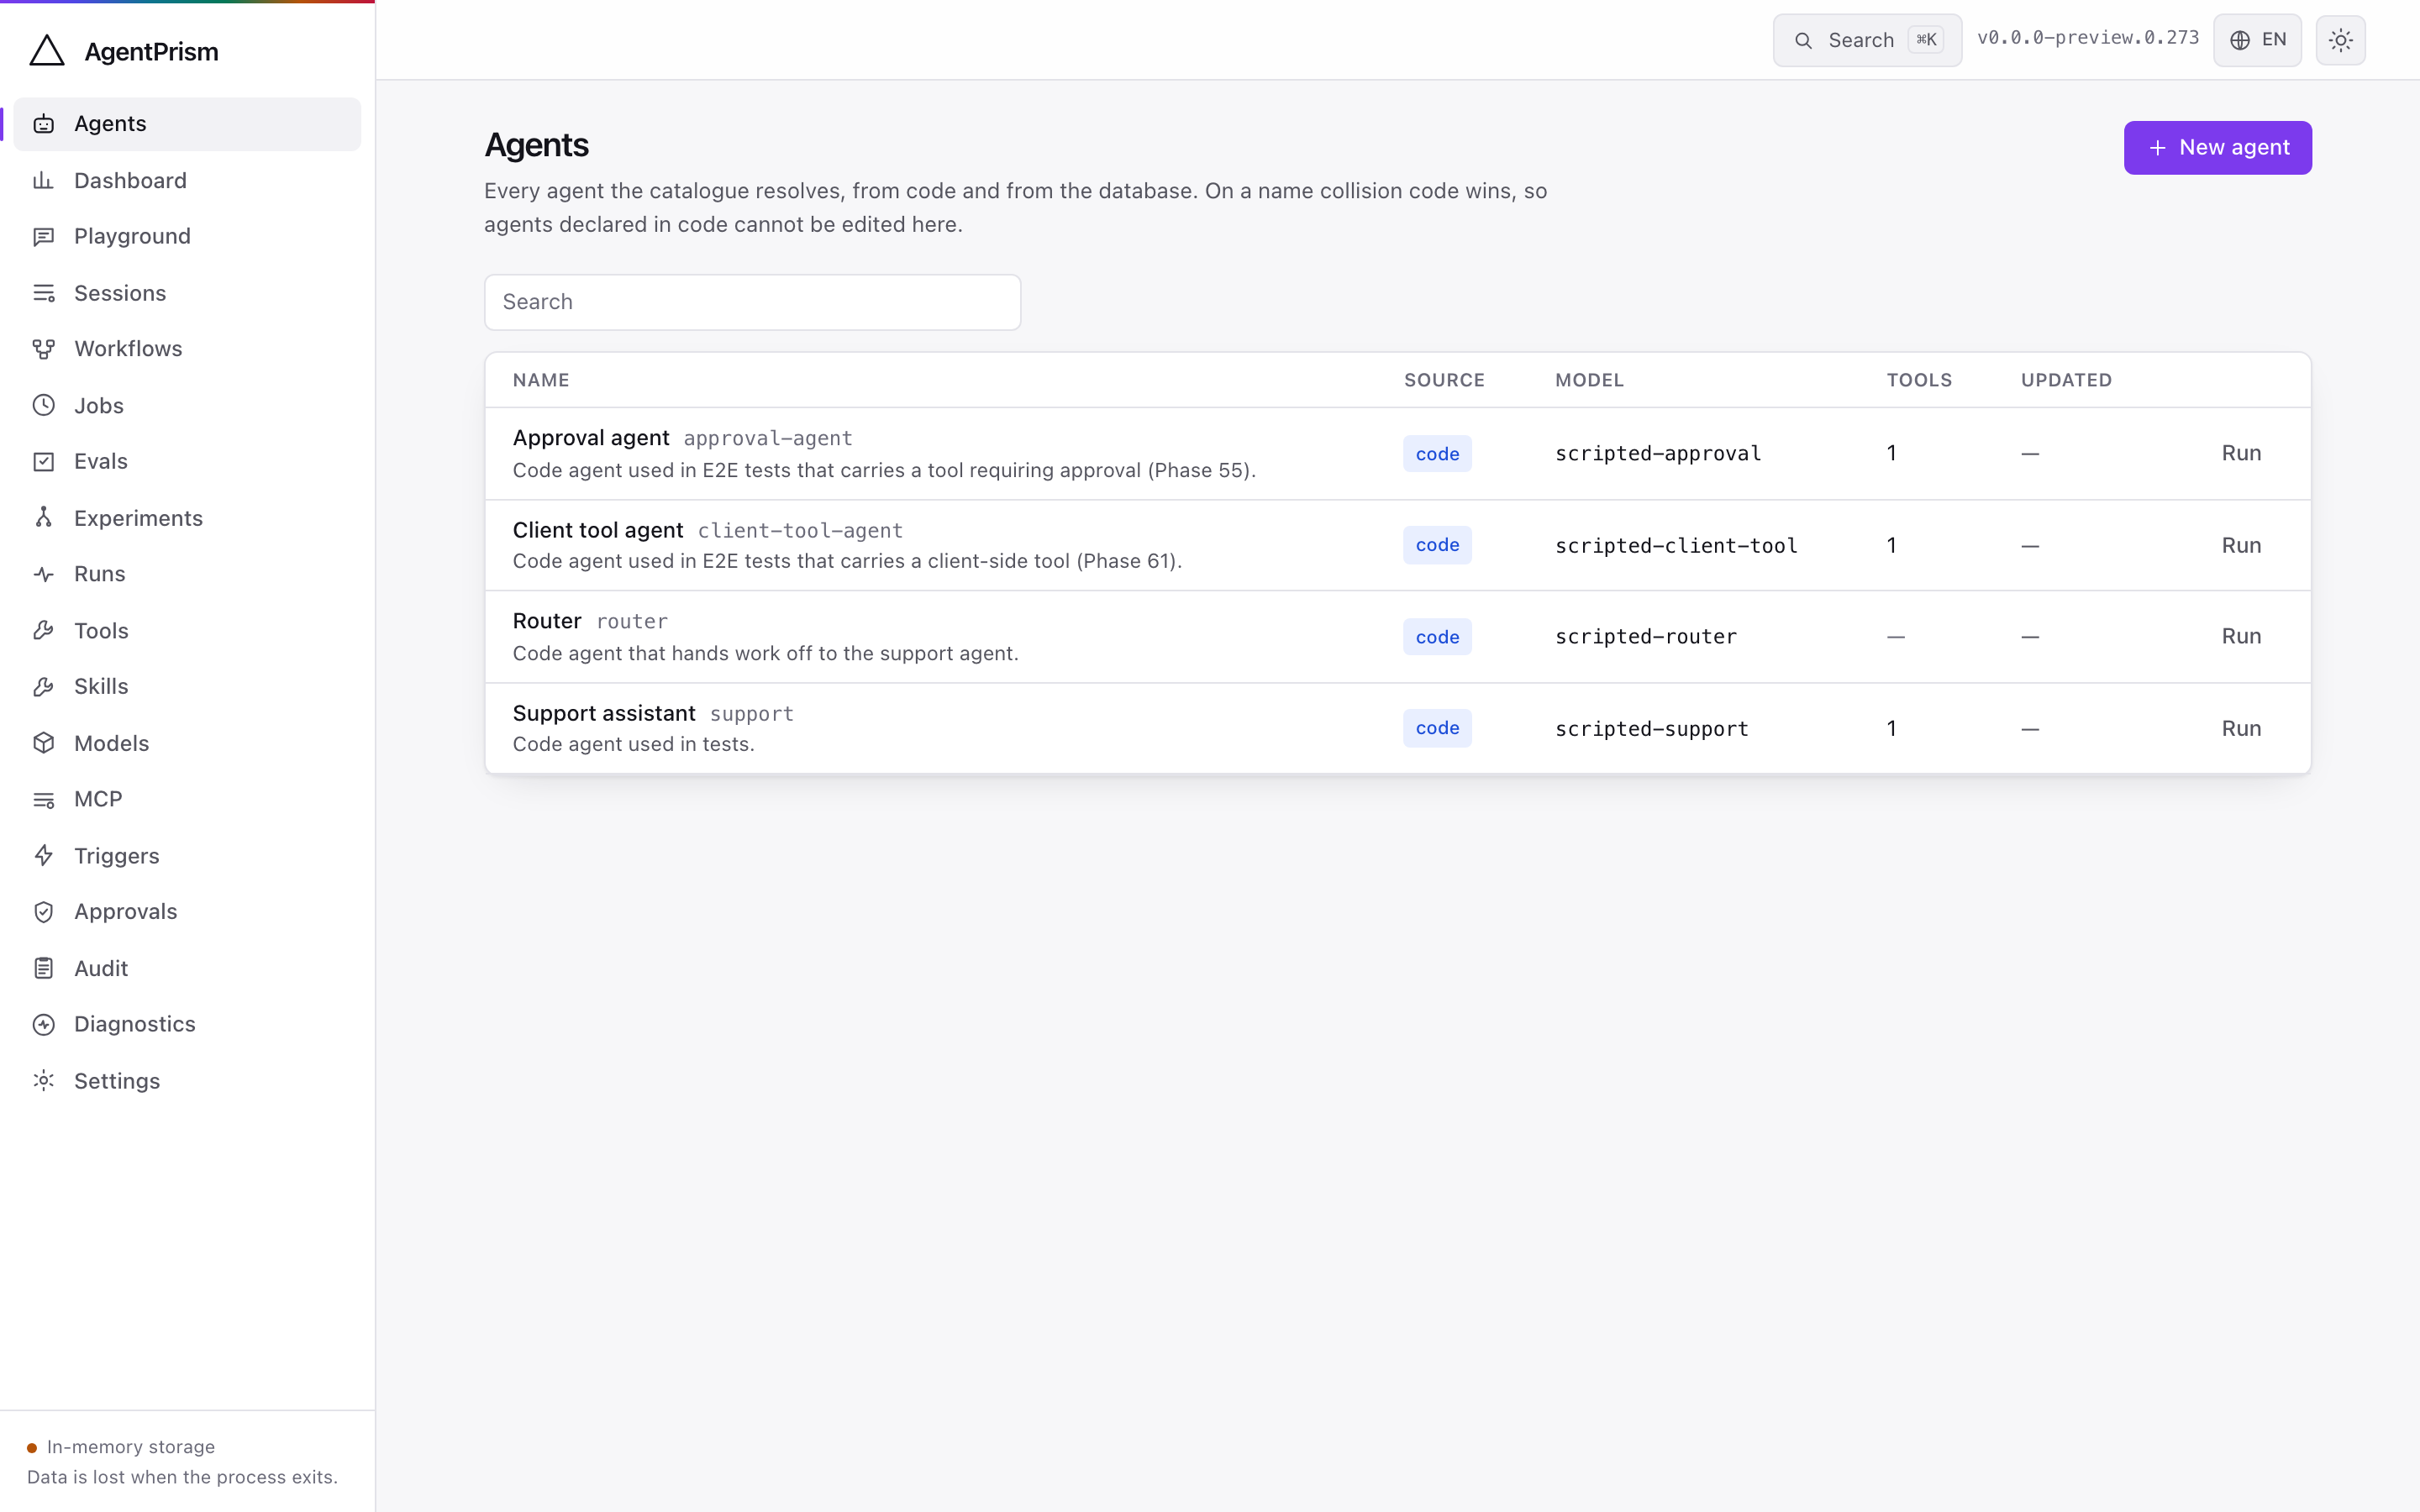
Code-defined and database-defined agents in one list. The origin is on each entry, because it decides what you can do: a code agent can be run and read but not edited, and the console hides the edit form rather than offering one that would fail.
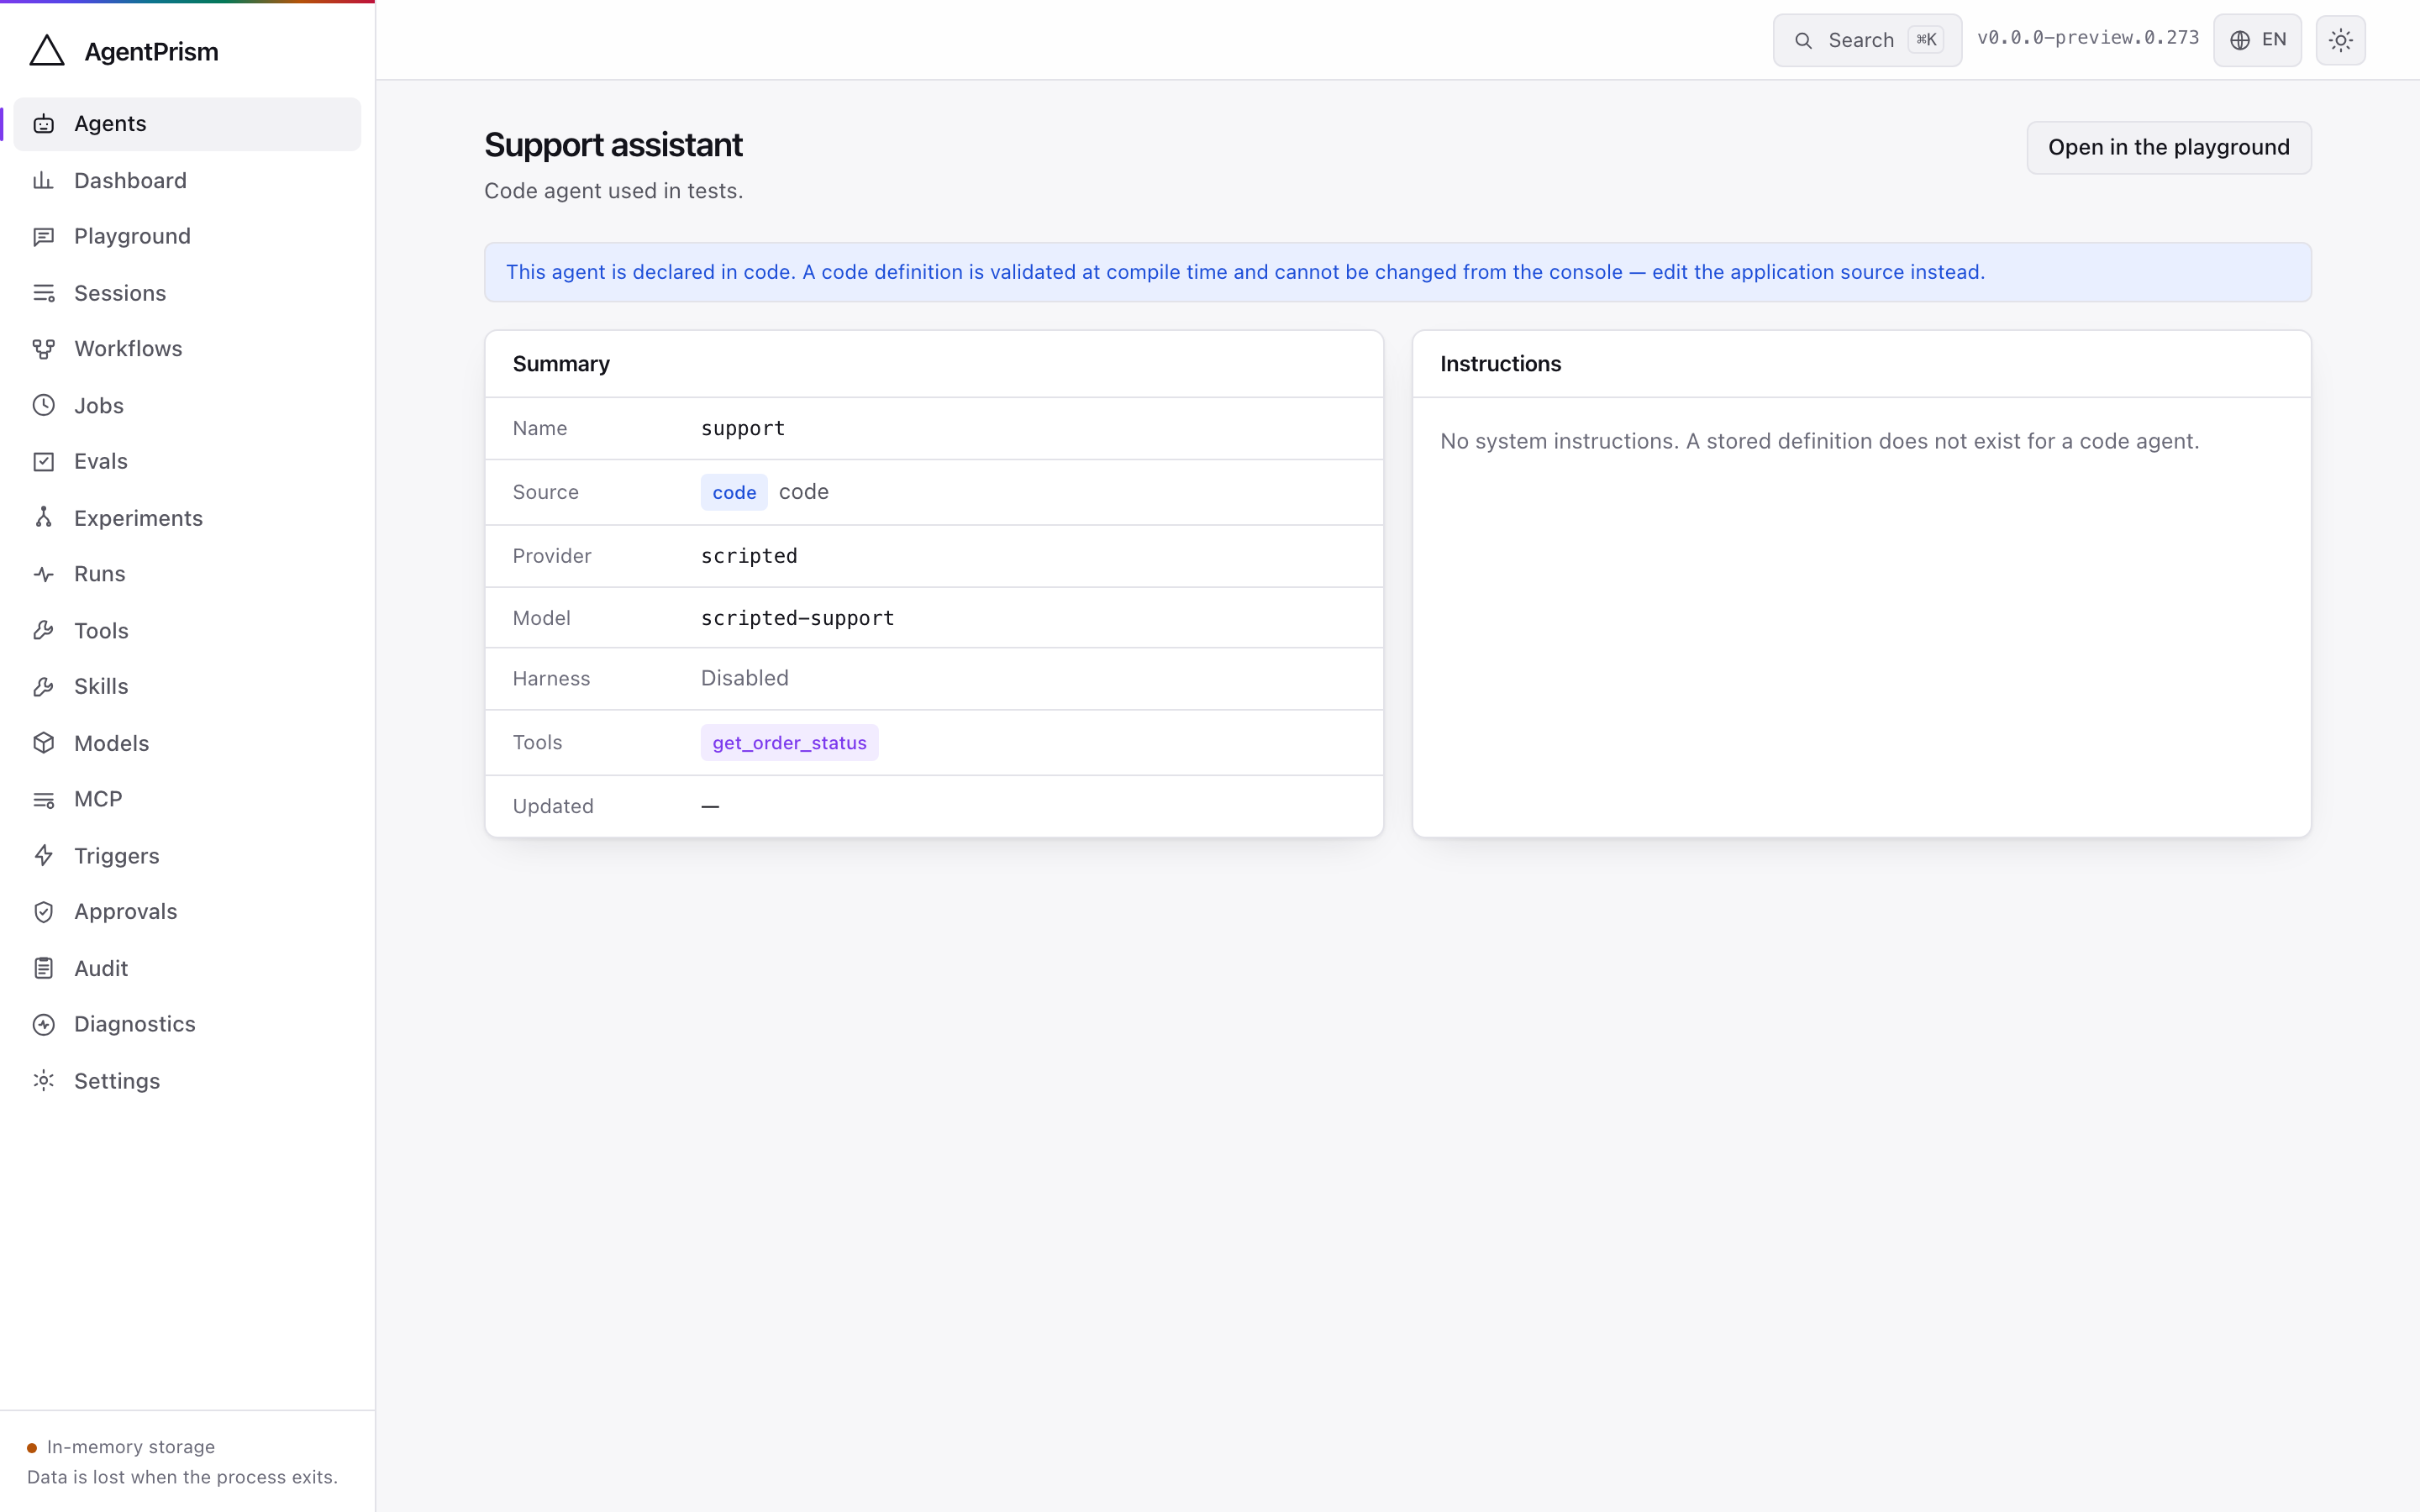
The detail screen carries the model binding, tools, skills, callable agents, and — for a database agent — the version history with a diff between any two versions and a one-click rollback.
The editor validates as you save, using the same rules the compiler applies. An unknown tool or skill name is refused at write time, not on the first run.
The instructions panel also holds a culture-keyed section: add a culture tag
(tr, de, …) with its own instructions text, and a run requesting that
culture picks it up (see Culture-keyed instructions).
The version diff screen shows each culture’s text as its own section.
Playground
Section titled “Playground”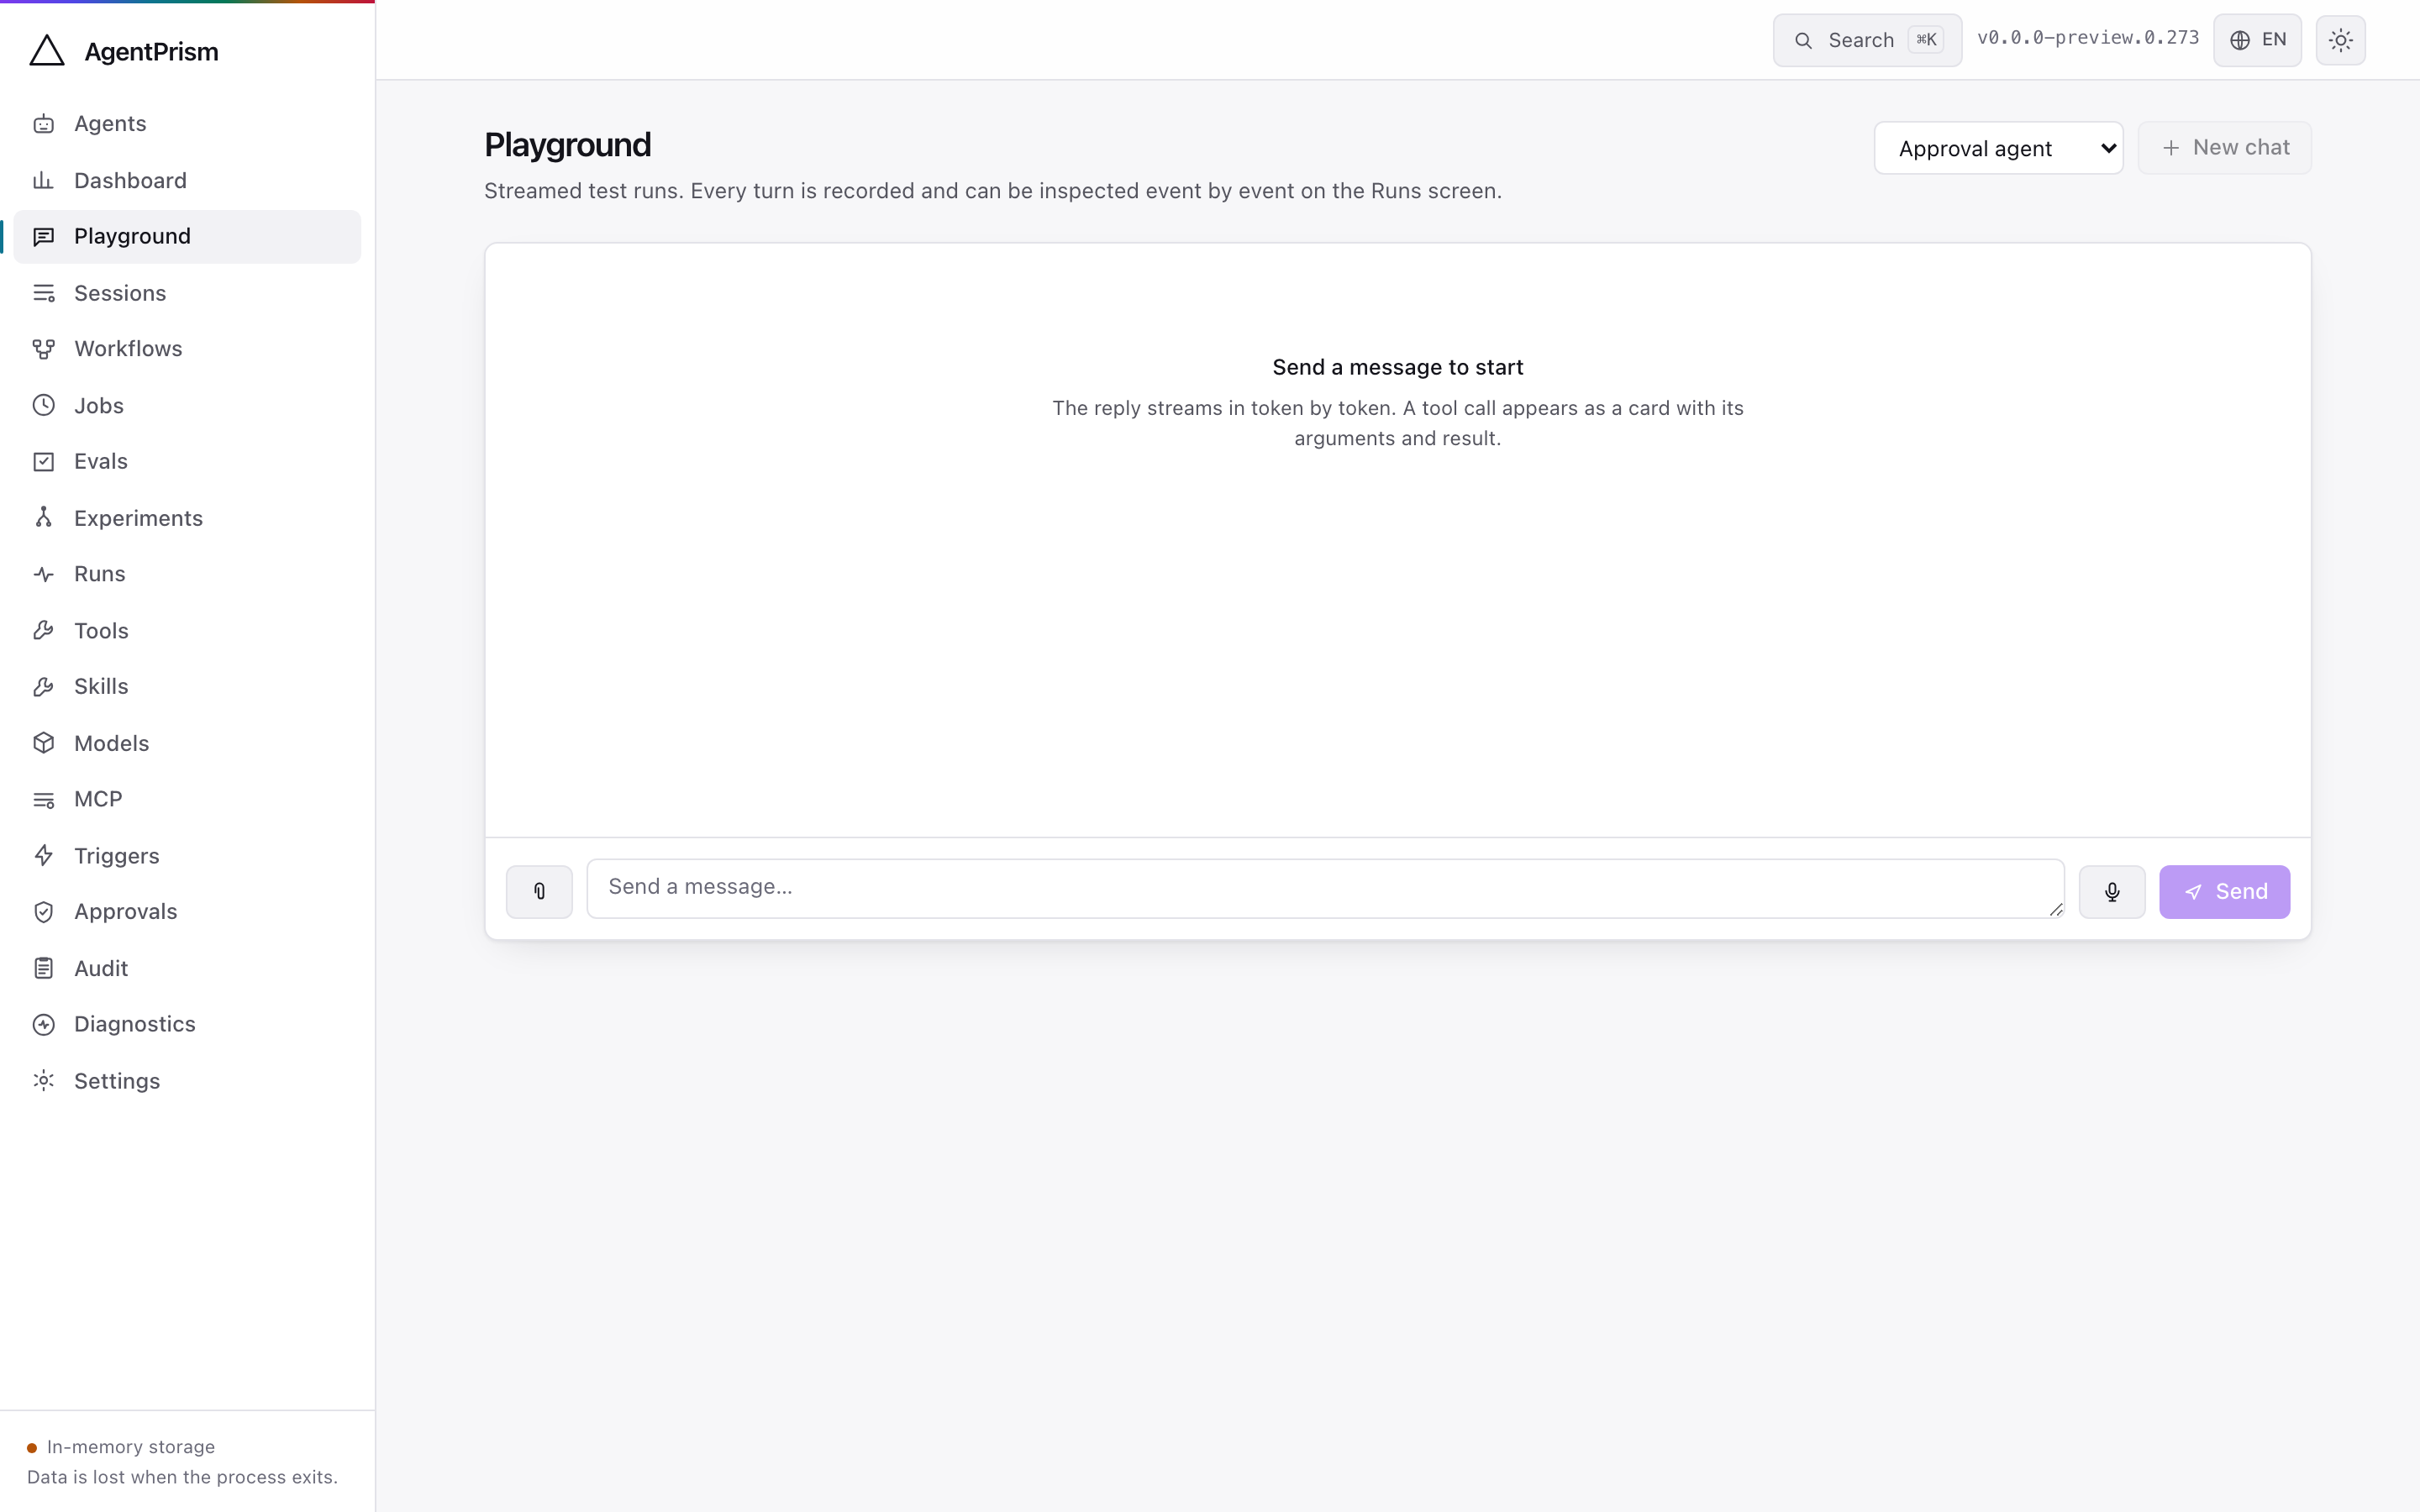
Talk to an agent. The reply streams token by token and tool calls appear as cards with their arguments and their results, so you can see why an answer came out the way it did rather than just reading the answer.
Attachments can be added to a message, and with the voice layer enabled there is a live conversation mode.
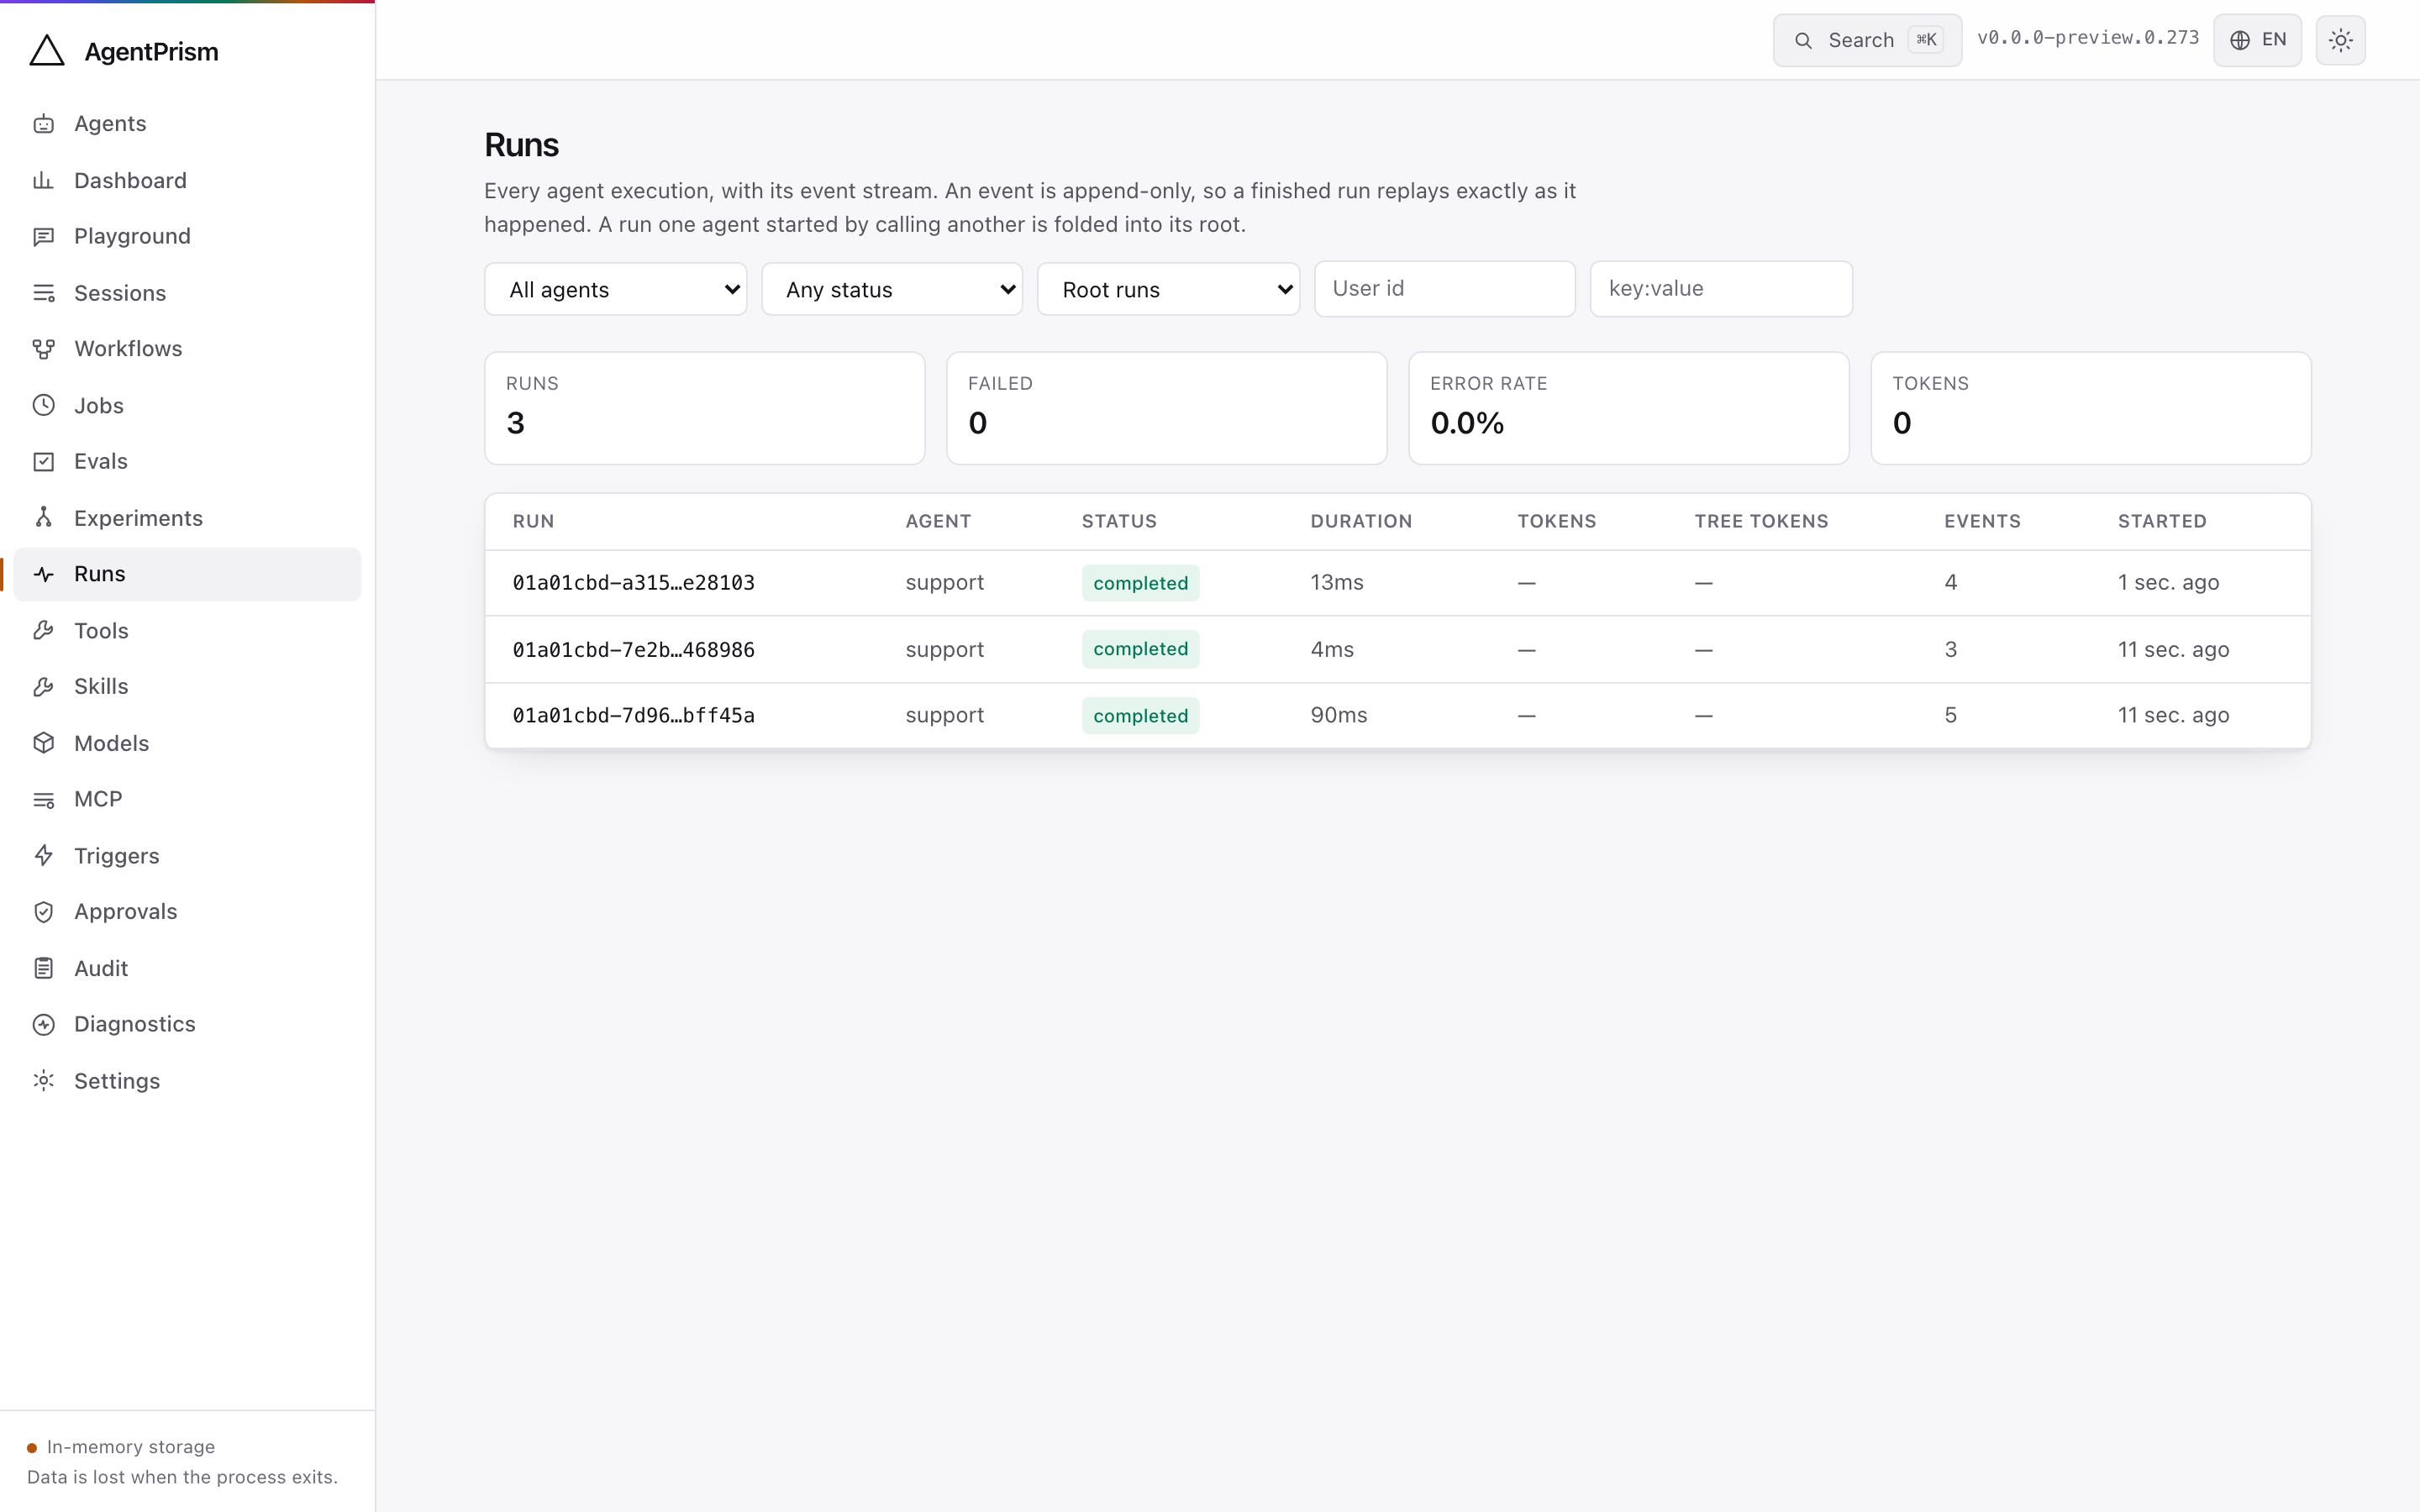
Every execution, filterable by agent, status, and kind — and, once your application
binds IRunAttributionContext, by user and by label (key:value, or a bare
key to match any value of it). Only root runs are shown by default — otherwise a
single question that fanned out to four agents would fill the list with rows nobody
started.
A run’s detail header names the user it belongs to and shows its labels as badges.
Opening a run gives the summary and the full event stream in order: message deltas, tool calls with arguments and results, errors with their class. When a reasoning model’s thinking is recorded, it renders as its own collapsible block, separate from the answer. A run that called other agents shows the whole tree, and each agent’s tokens and duration are attributed separately.
Two runs can be compared side by side, and any run can be scored — those scores sit next to the ones automatic judges write.
Sessions
Section titled “Sessions”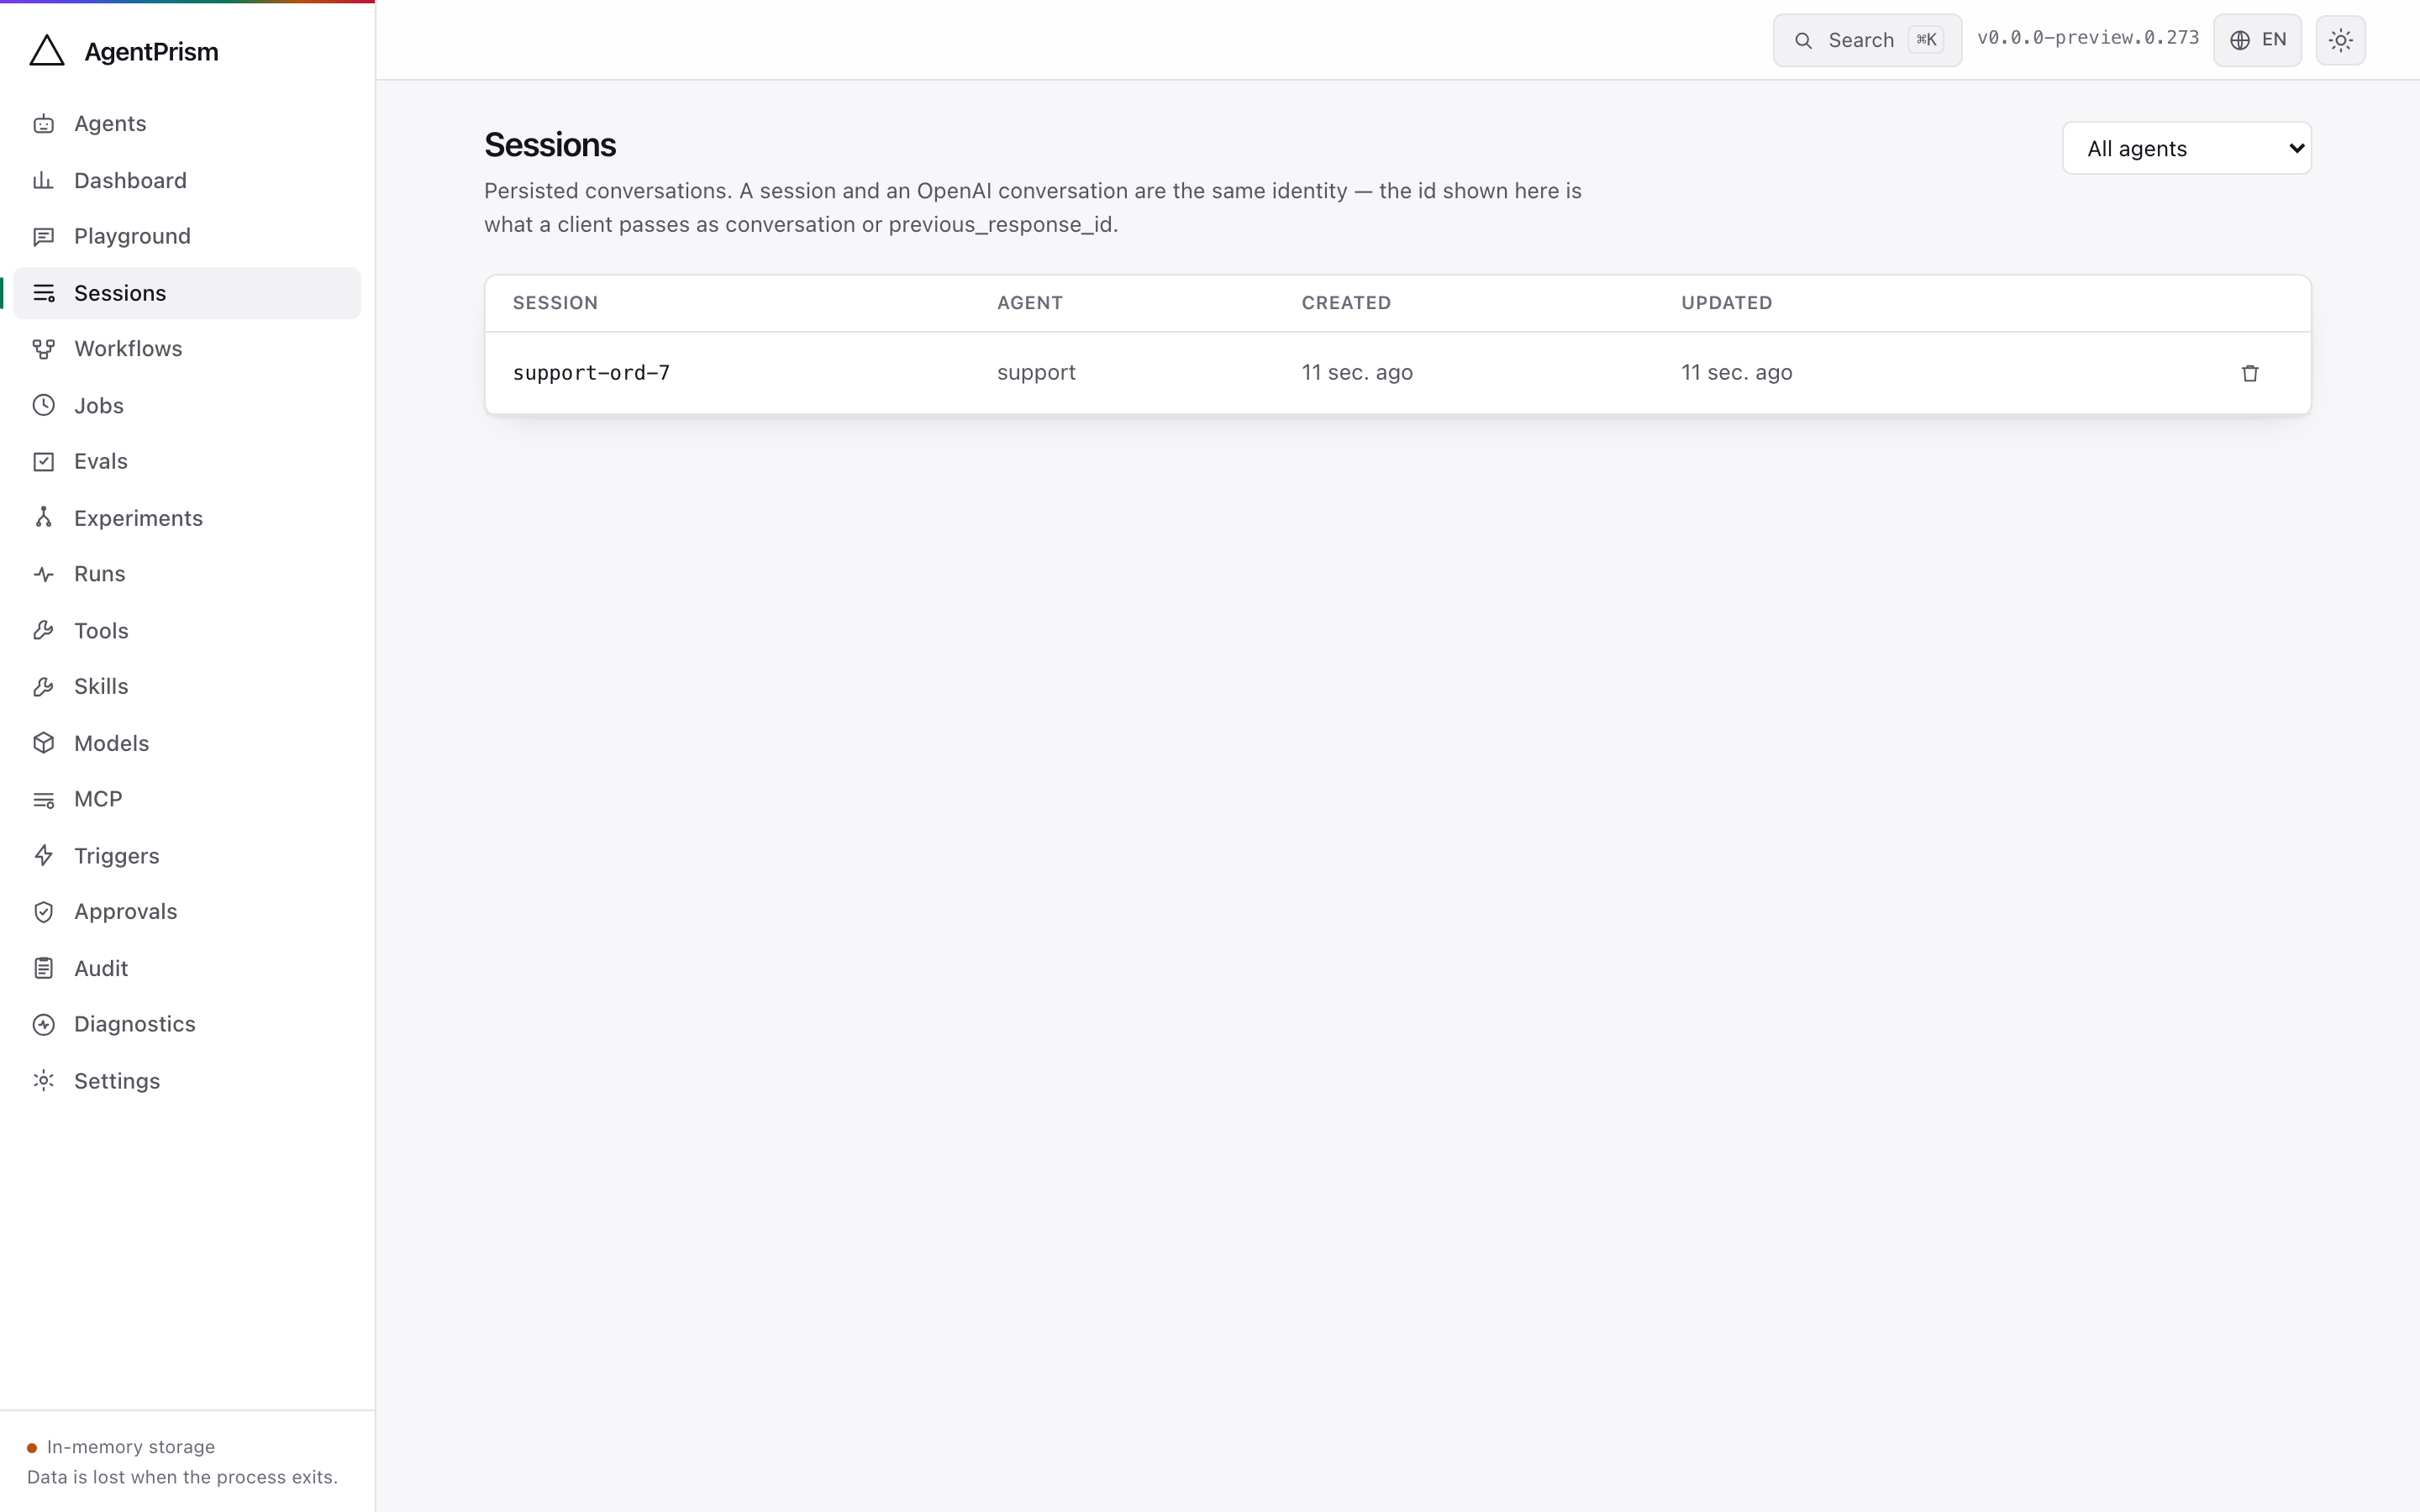
A session is a durable conversation. The list shows every session the active store knows about, with its agent, message count, and last activity; opening one reads the conversation back turn by turn, exactly as the model saw it.
Two things are only visible here. A session can be branched from any addressable item, which forks the conversation without touching the original — the fork opens as a new session with its own id. And attachments referenced by a message are listed with their type and size, so you can see what actually reached the provider.
In-memory storage keeps sessions only for the life of the process. Reading a conversation back, and branching it, need a SQL store.
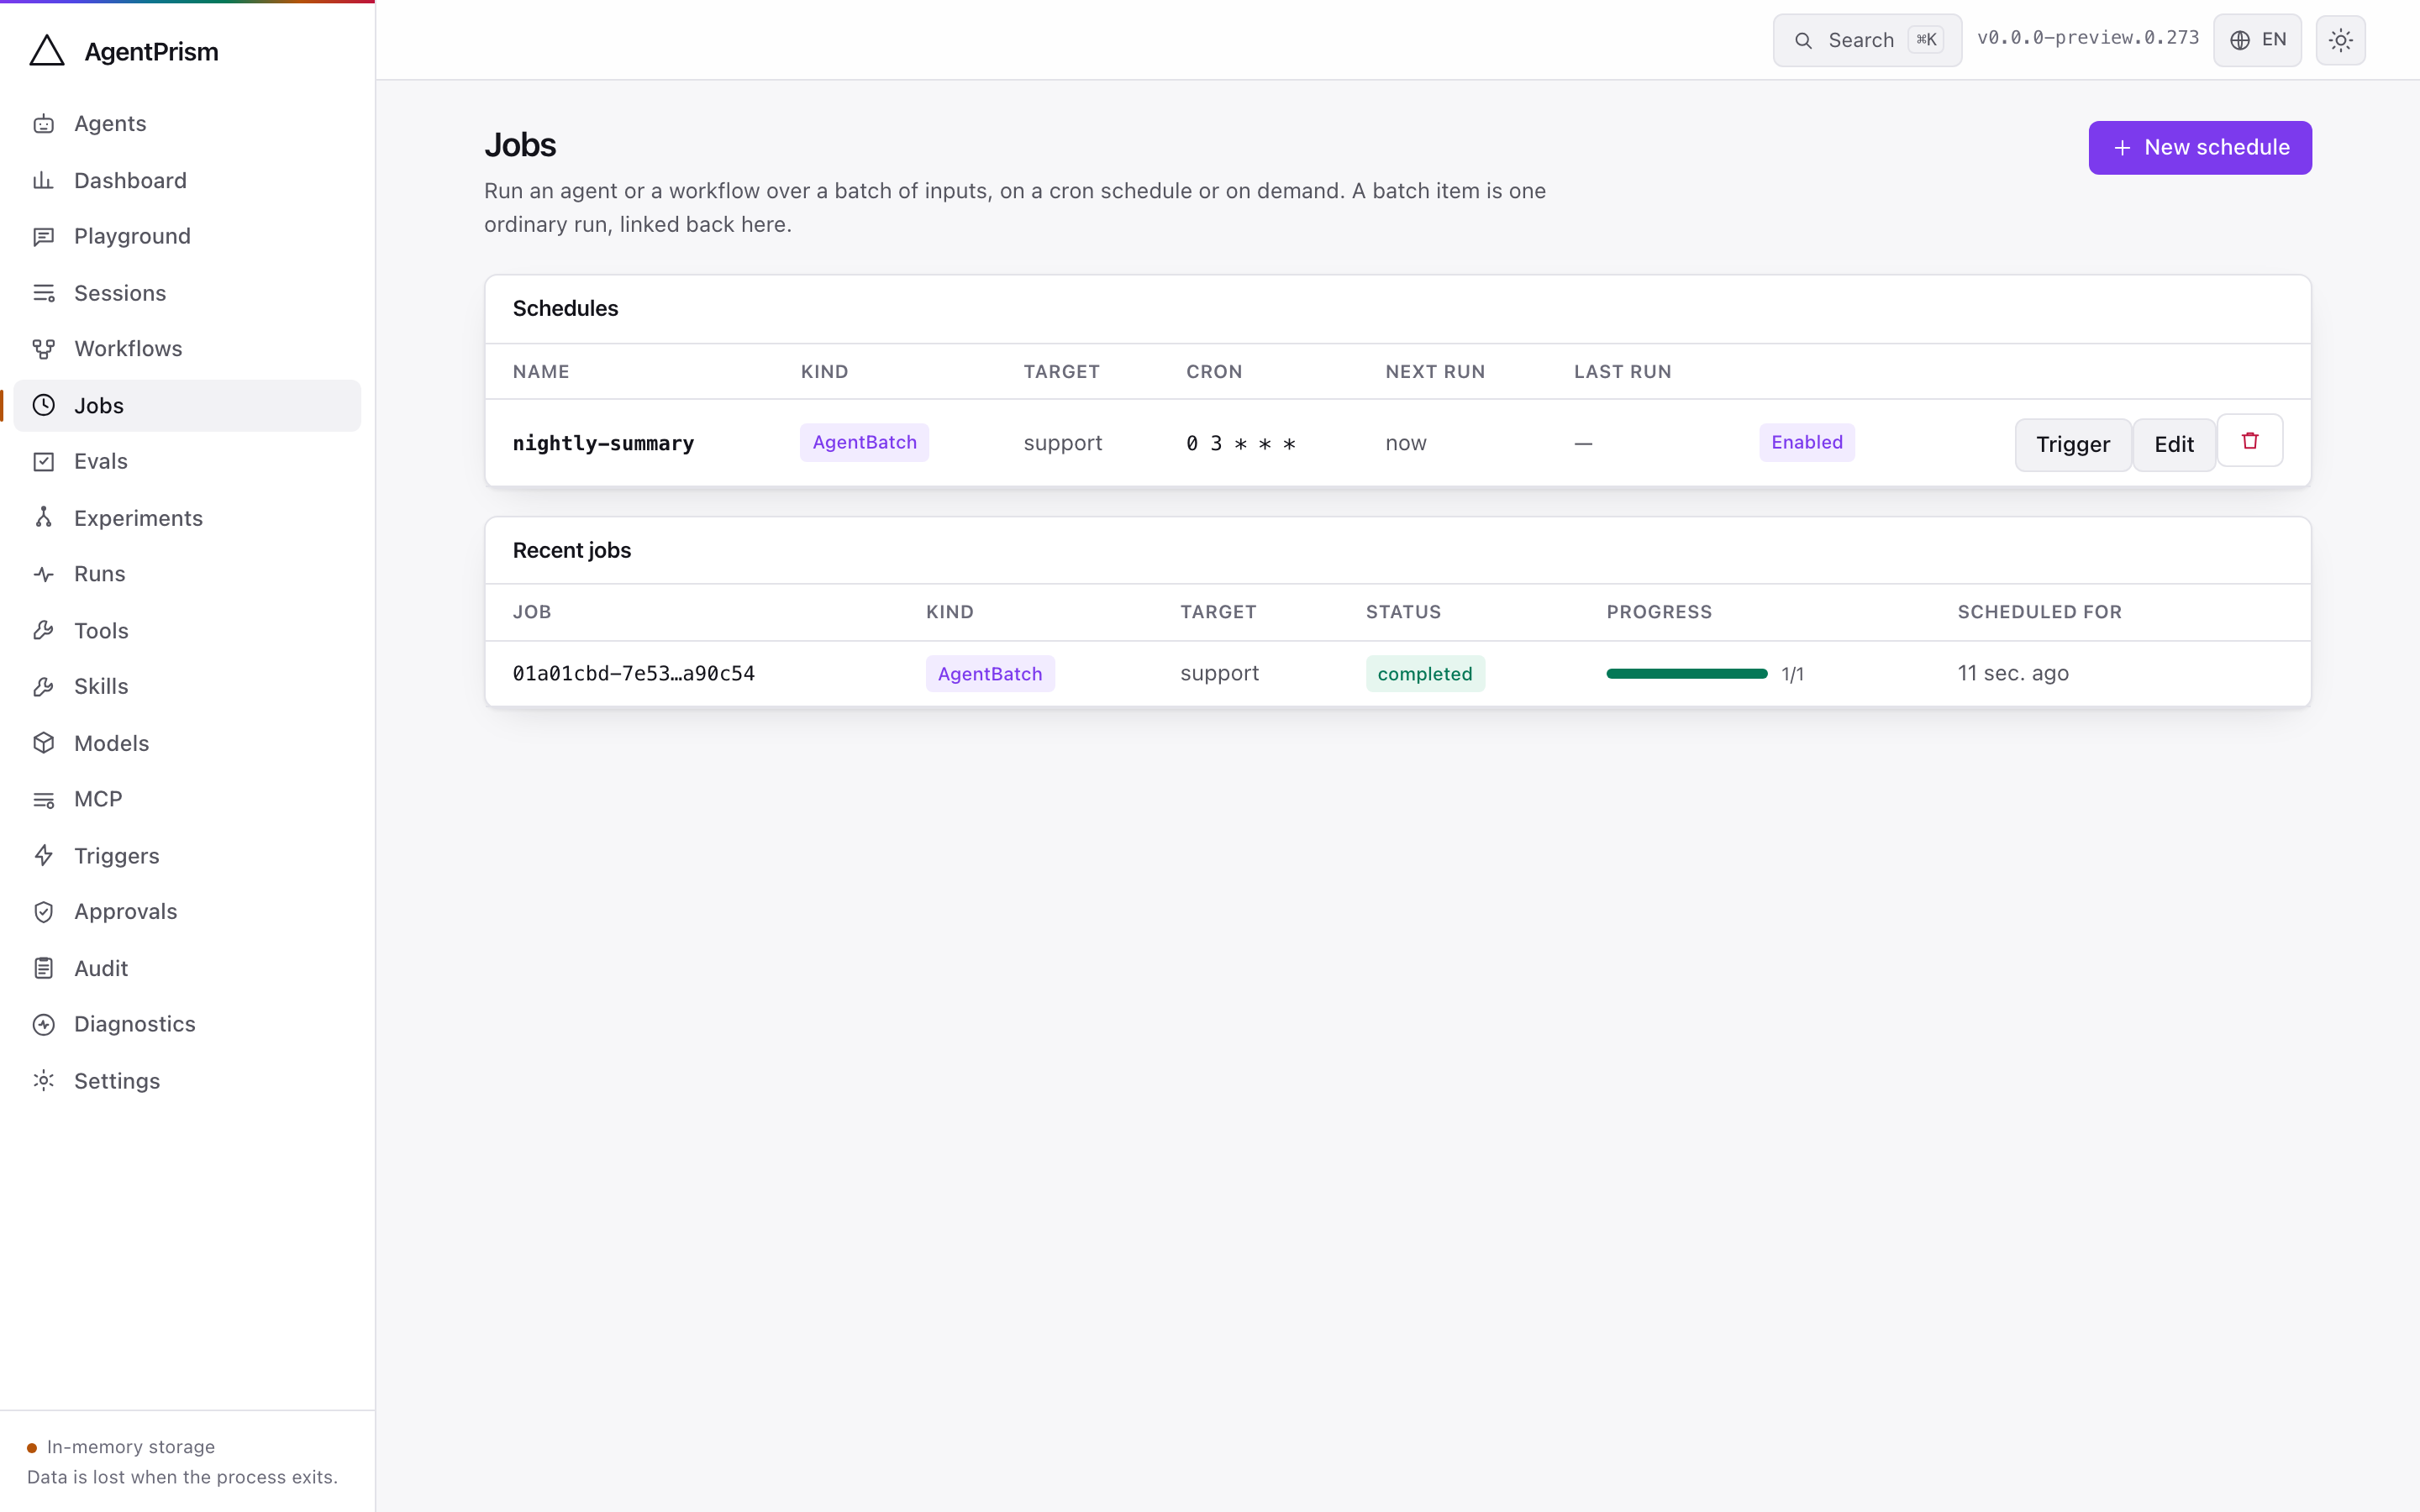
Everything AgentPrism runs in the background, in one queue: queued agent runs, scheduled runs, workflow executions, evaluation runs, online-evaluation scoring, and webhook deliveries. Each row carries its kind, status, attempt count, and — for a failure — the classified error.
Schedules live on the same screen. A schedule is a cron expression plus the payload to run; leaving the expression empty makes it manual-only, which is the honest way to park one. Triggering a schedule by hand queues exactly the job the timer would have.
The queue only drains in a process that opted in with UseScheduling(). A queue that
never moves is almost always an API process with no worker behind it — see
Jobs, schedules, and queues.
Workflows
Section titled “Workflows”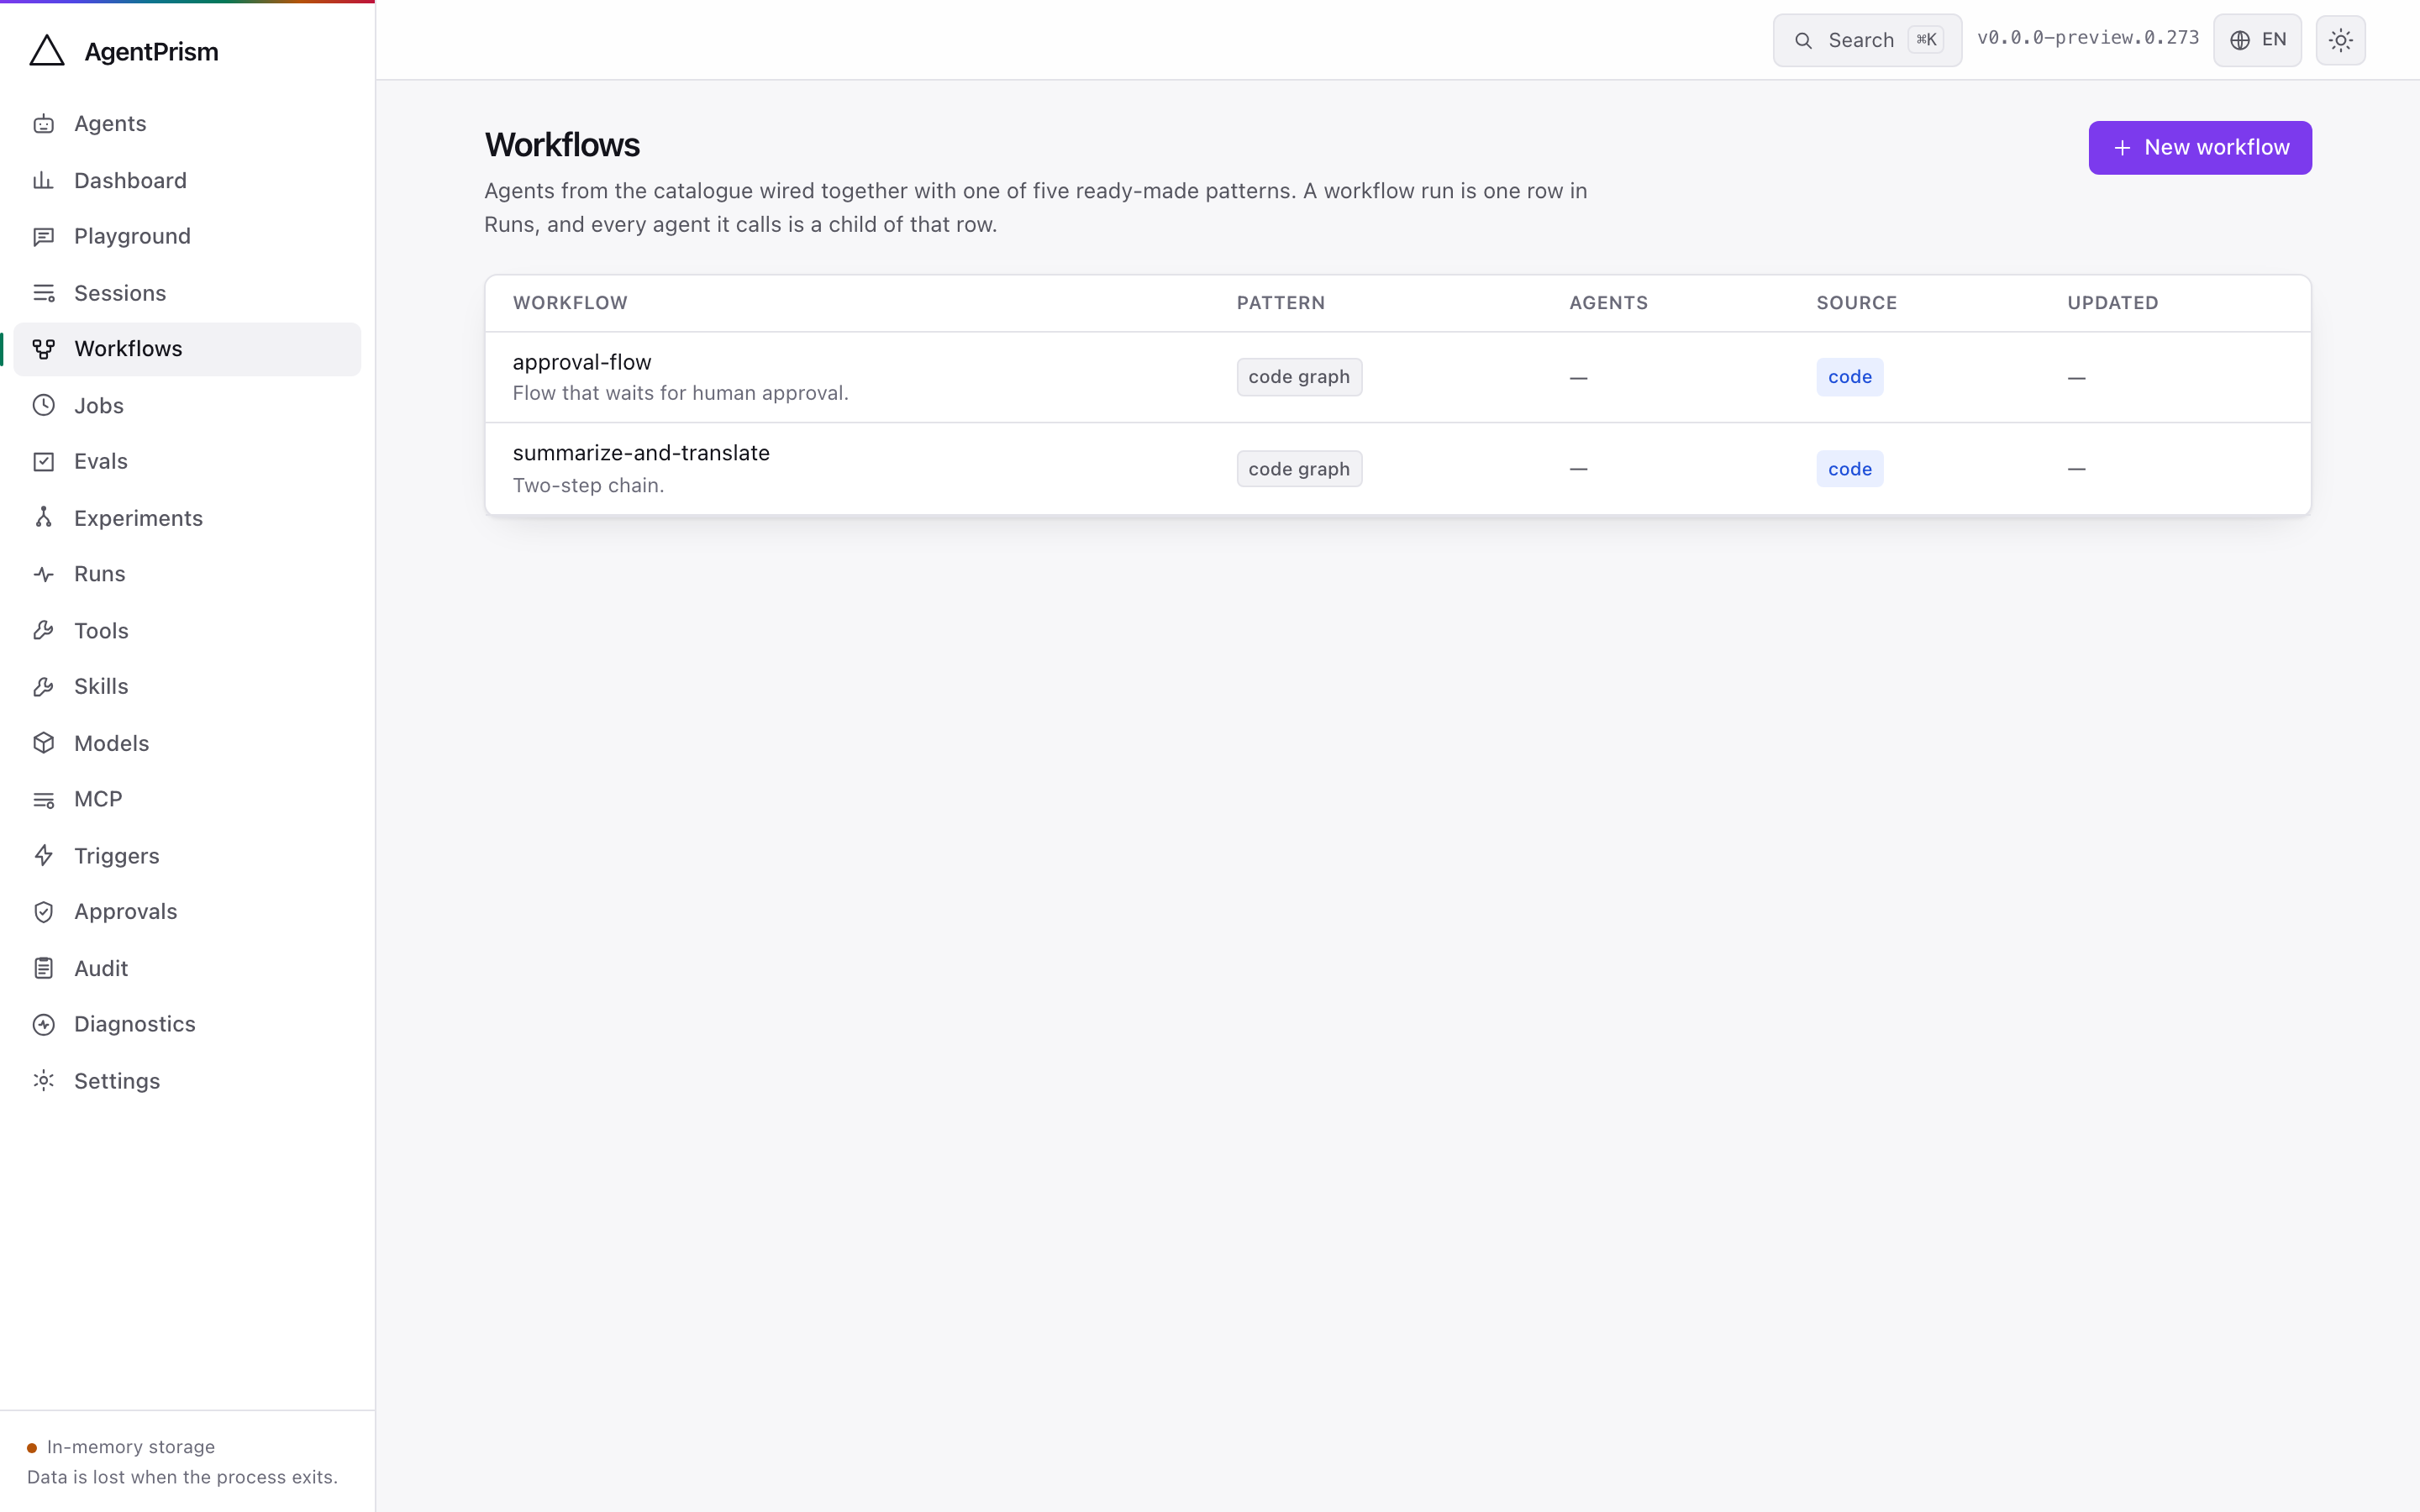
Workflows defined in code and in the database. Opening one draws the compiled graph, and the node ids are the same executor ids that appear in run events — which is how nodes light up live while a workflow runs.
A workflow waiting on human input shows the pending request as a card; answering it resumes execution from the checkpoint as a new run.
Evals and experiments
Section titled “Evals and experiments”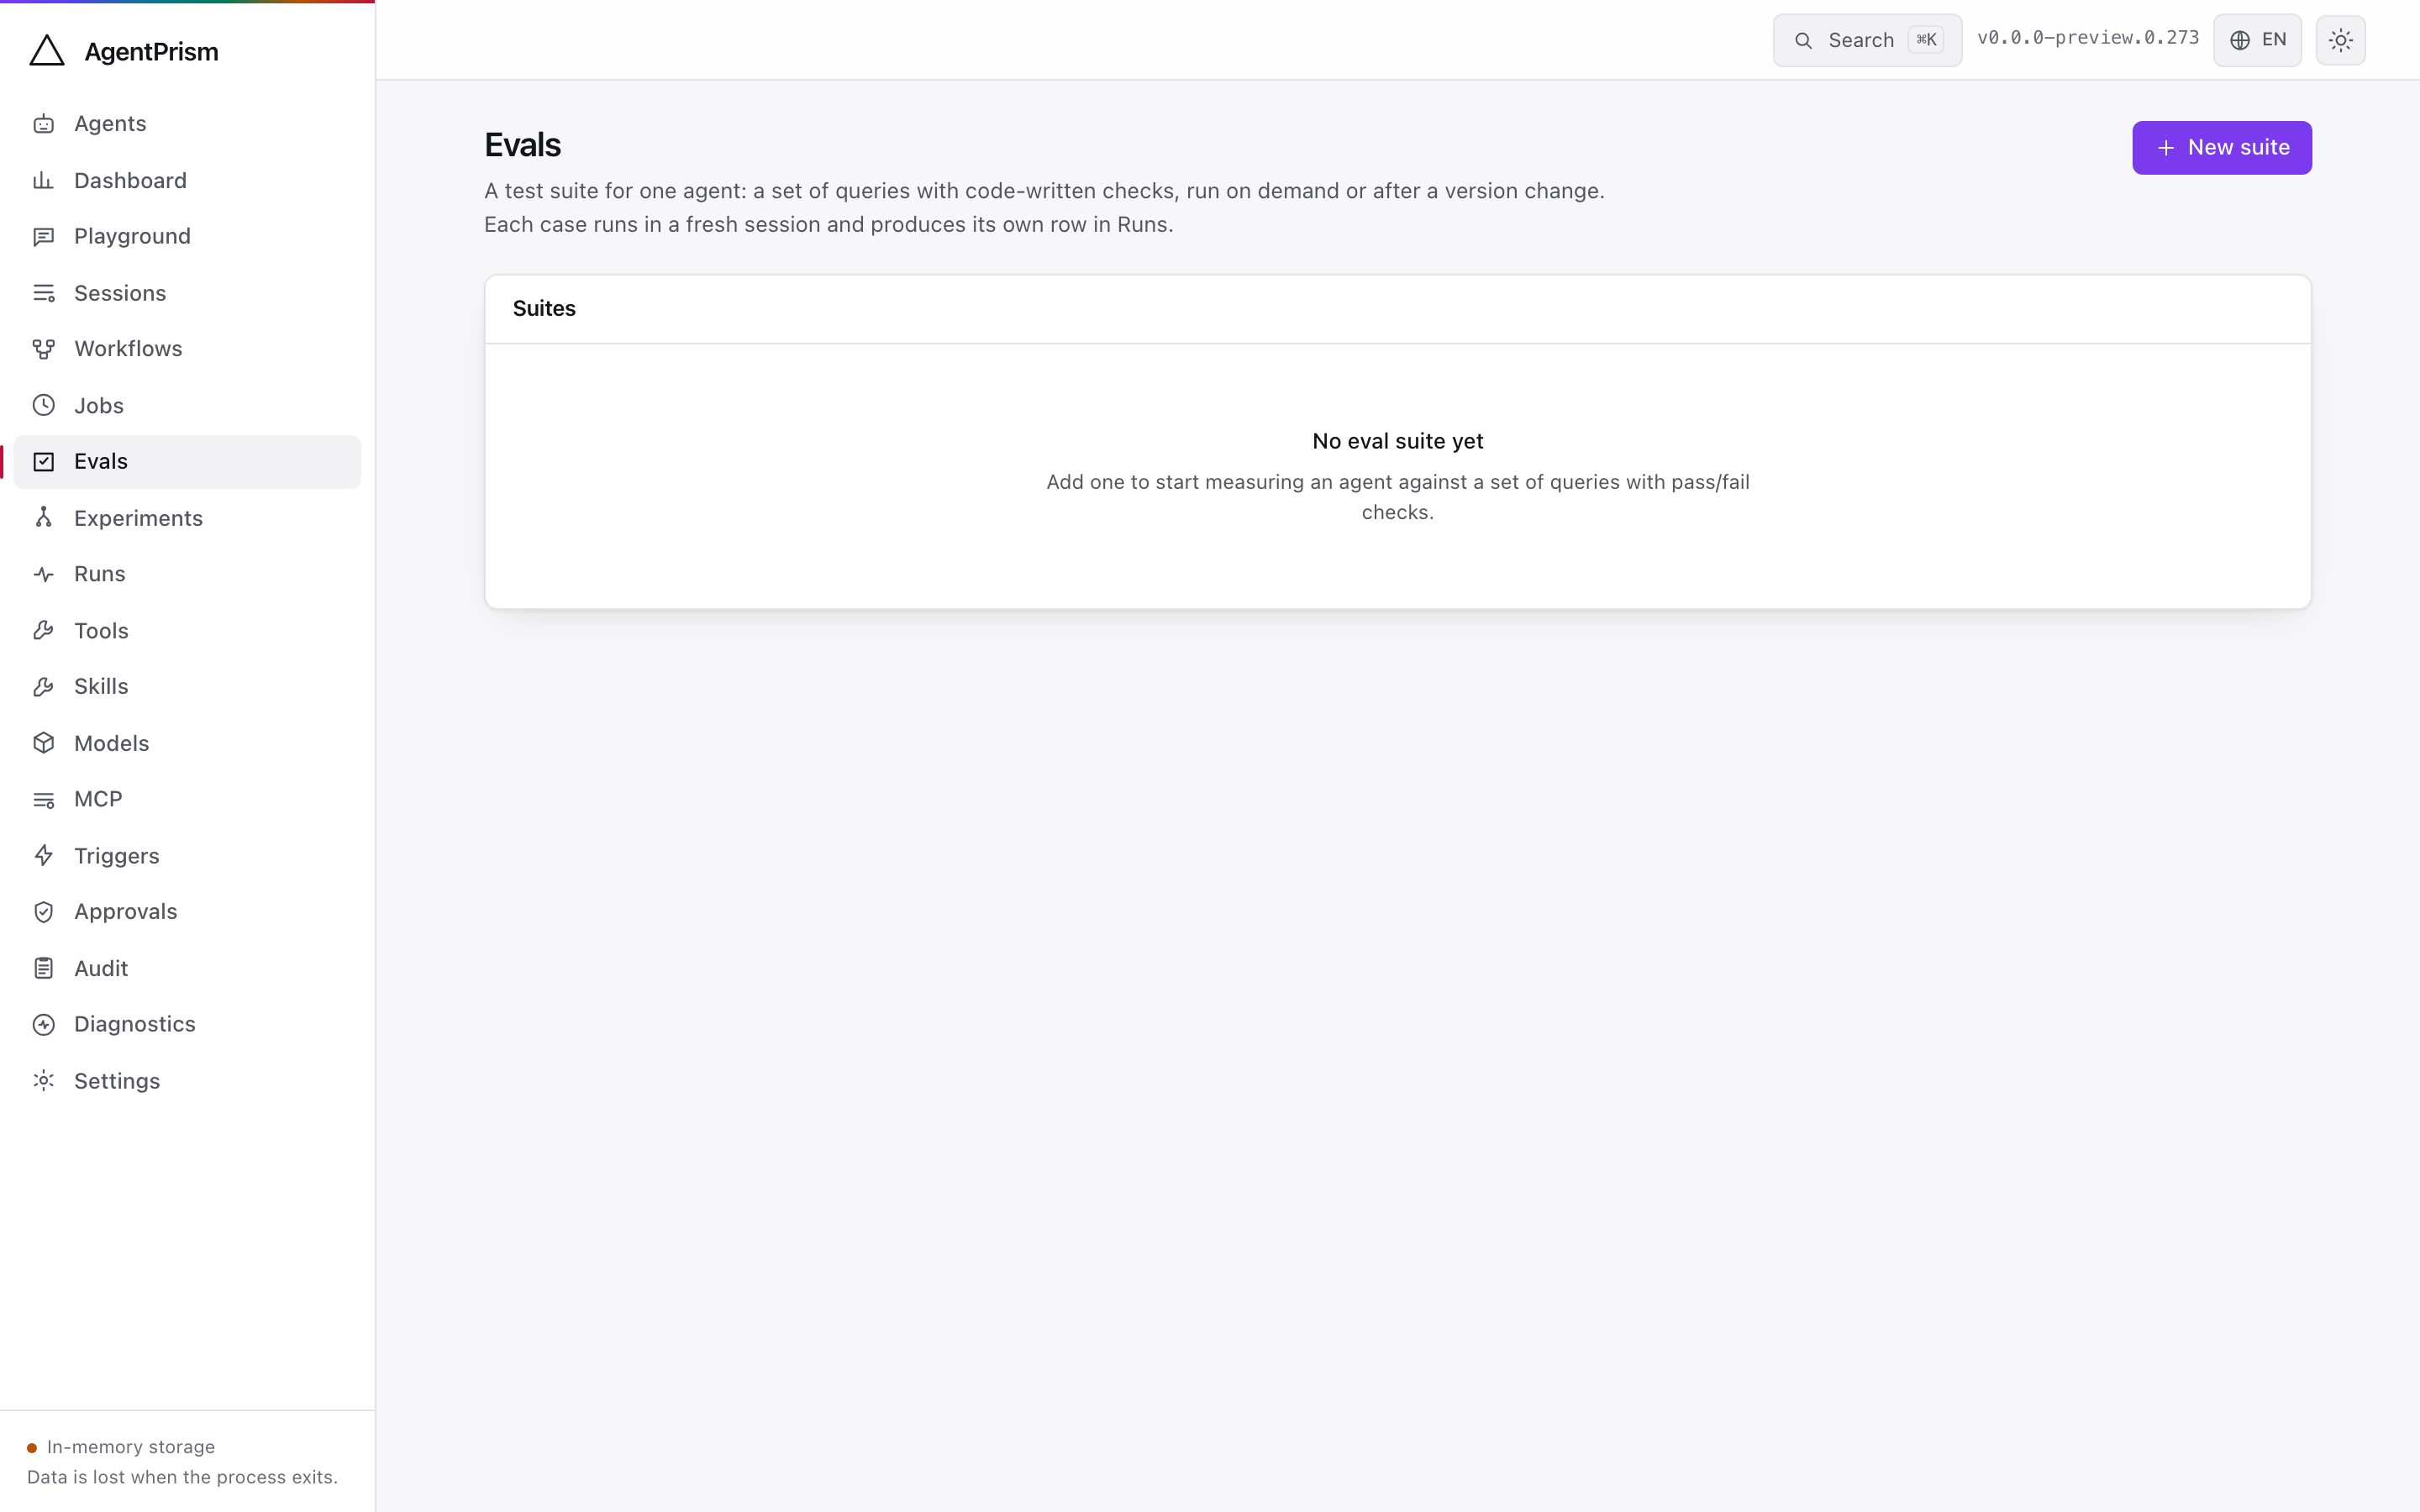
Suites, their cases, and their past runs. A case can be promoted straight from a real run, which is the fastest path from “this conversation went wrong” to “this is a regression test”.
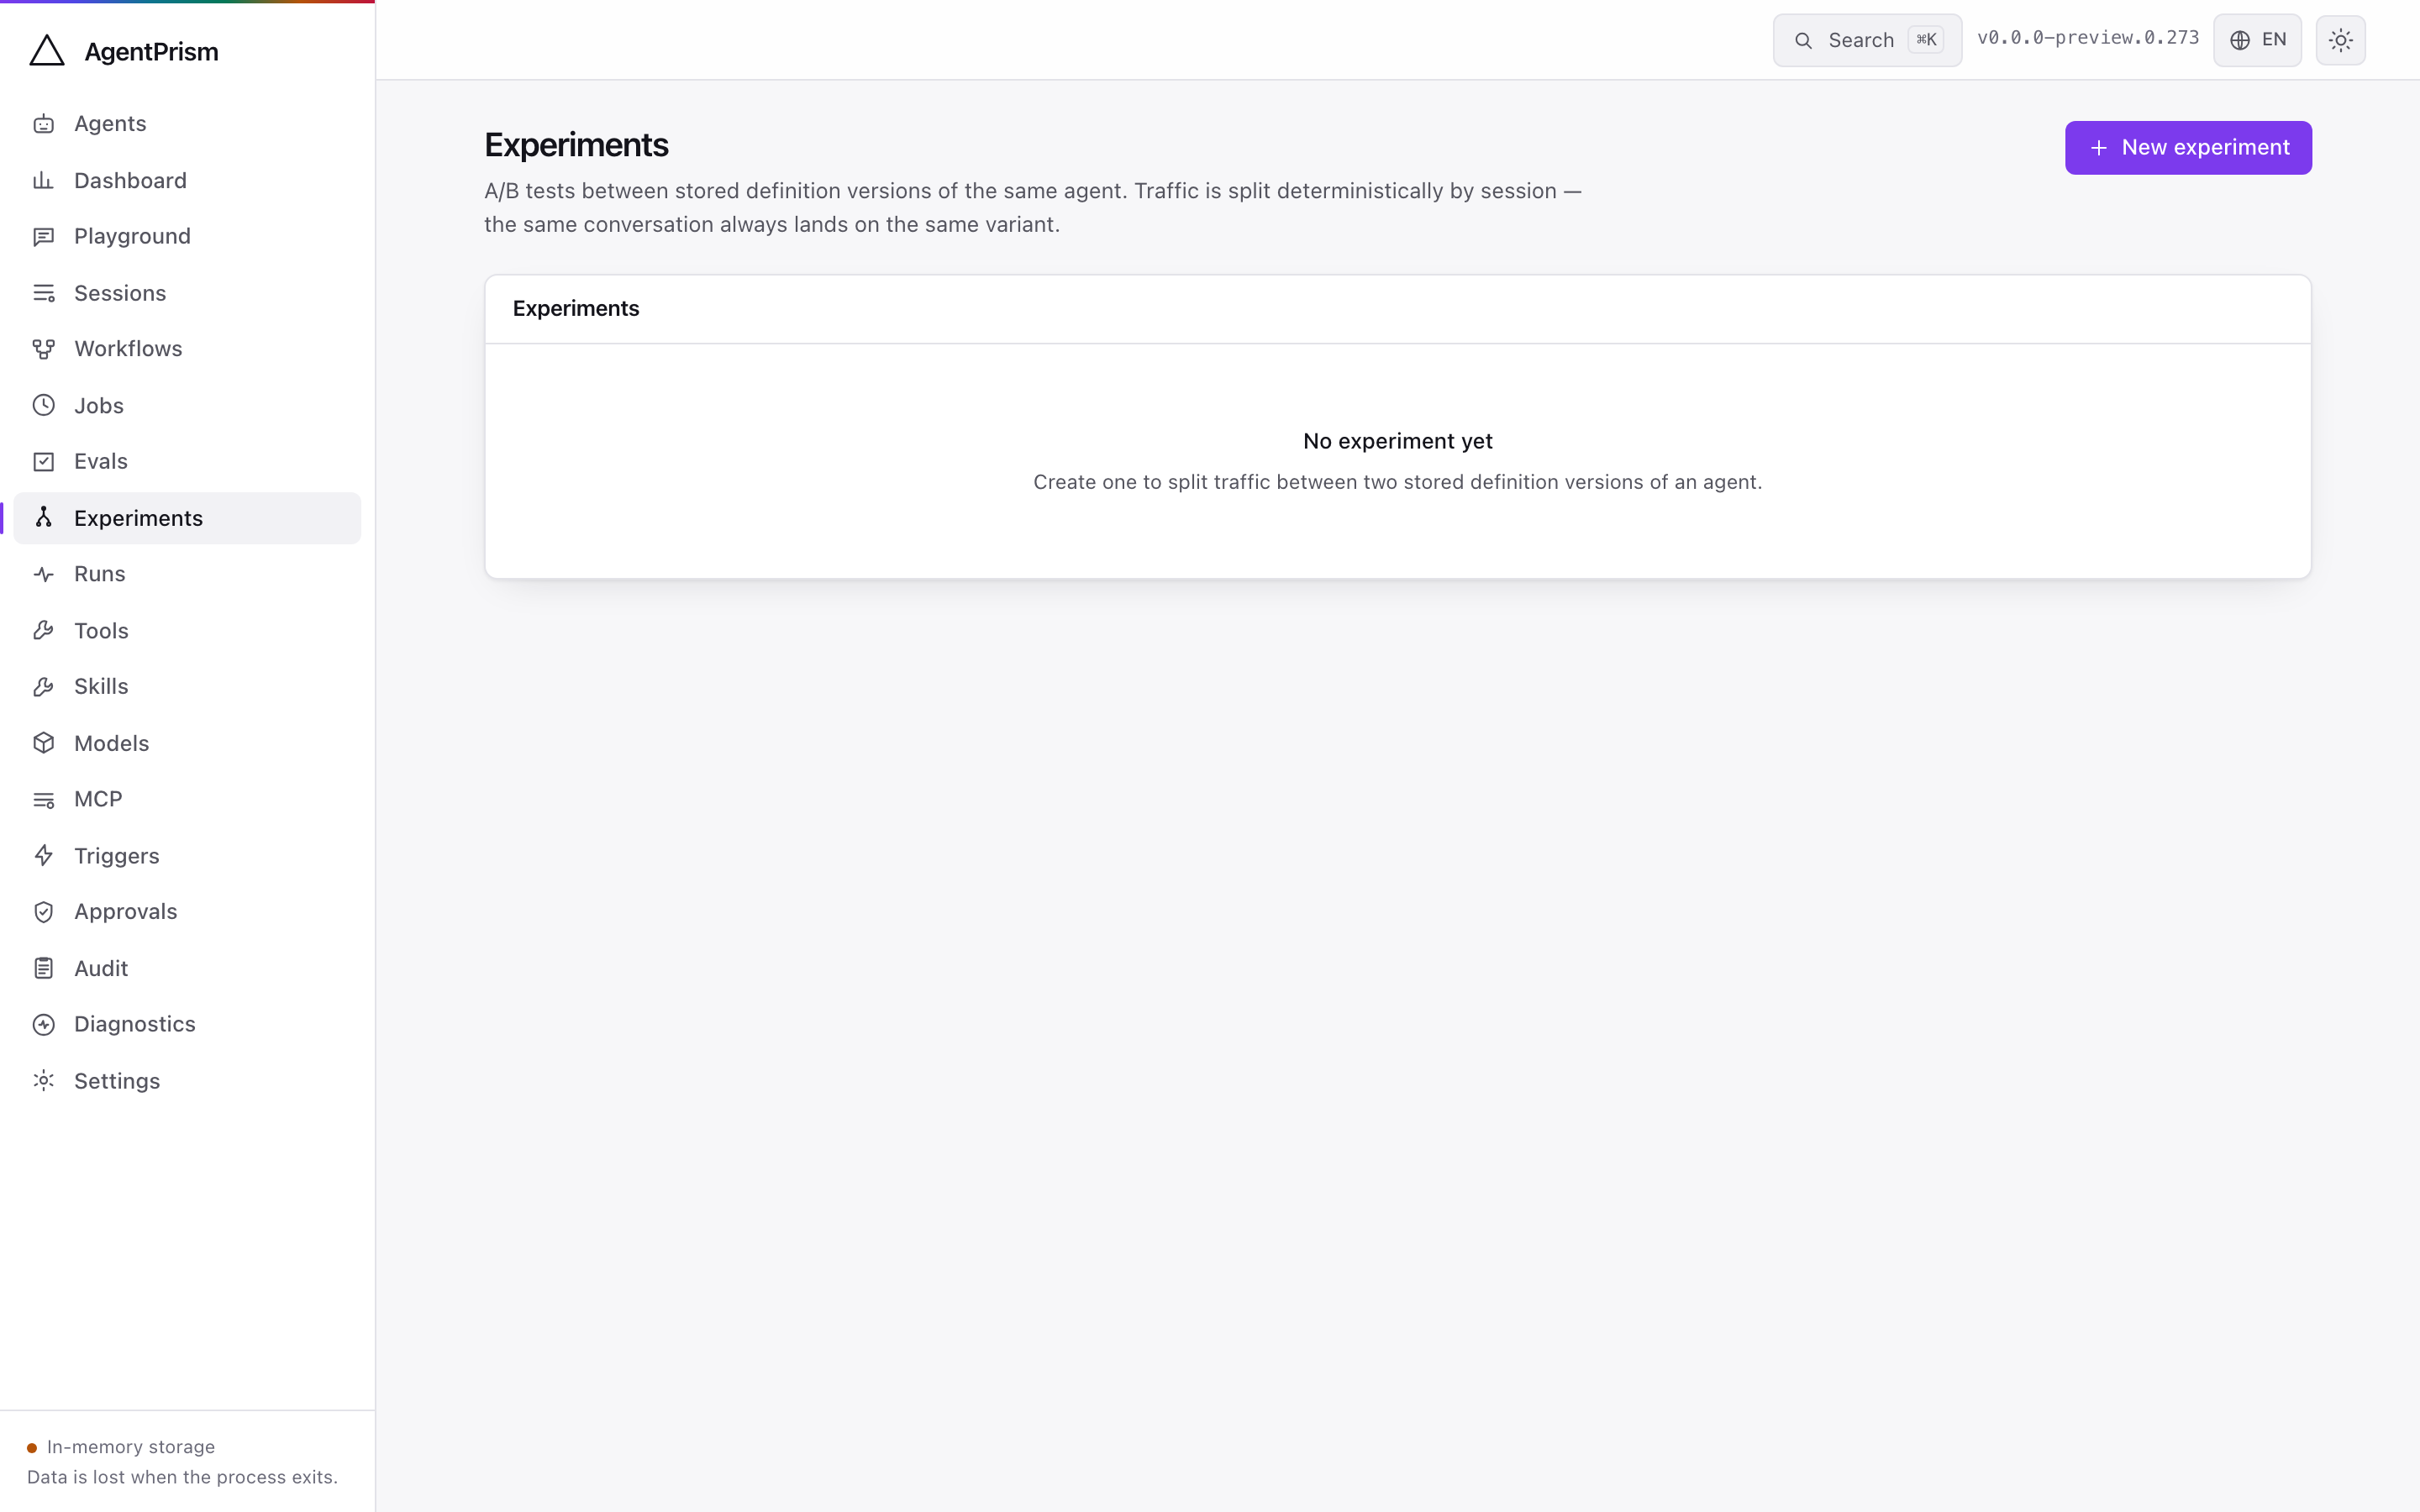
An experiment splits live traffic between two versions of the same agent. The results show per-arm counts, error rates, tokens, and durations — and make no claim about a winner. The numbers are yours to judge.
Approvals
Section titled “Approvals”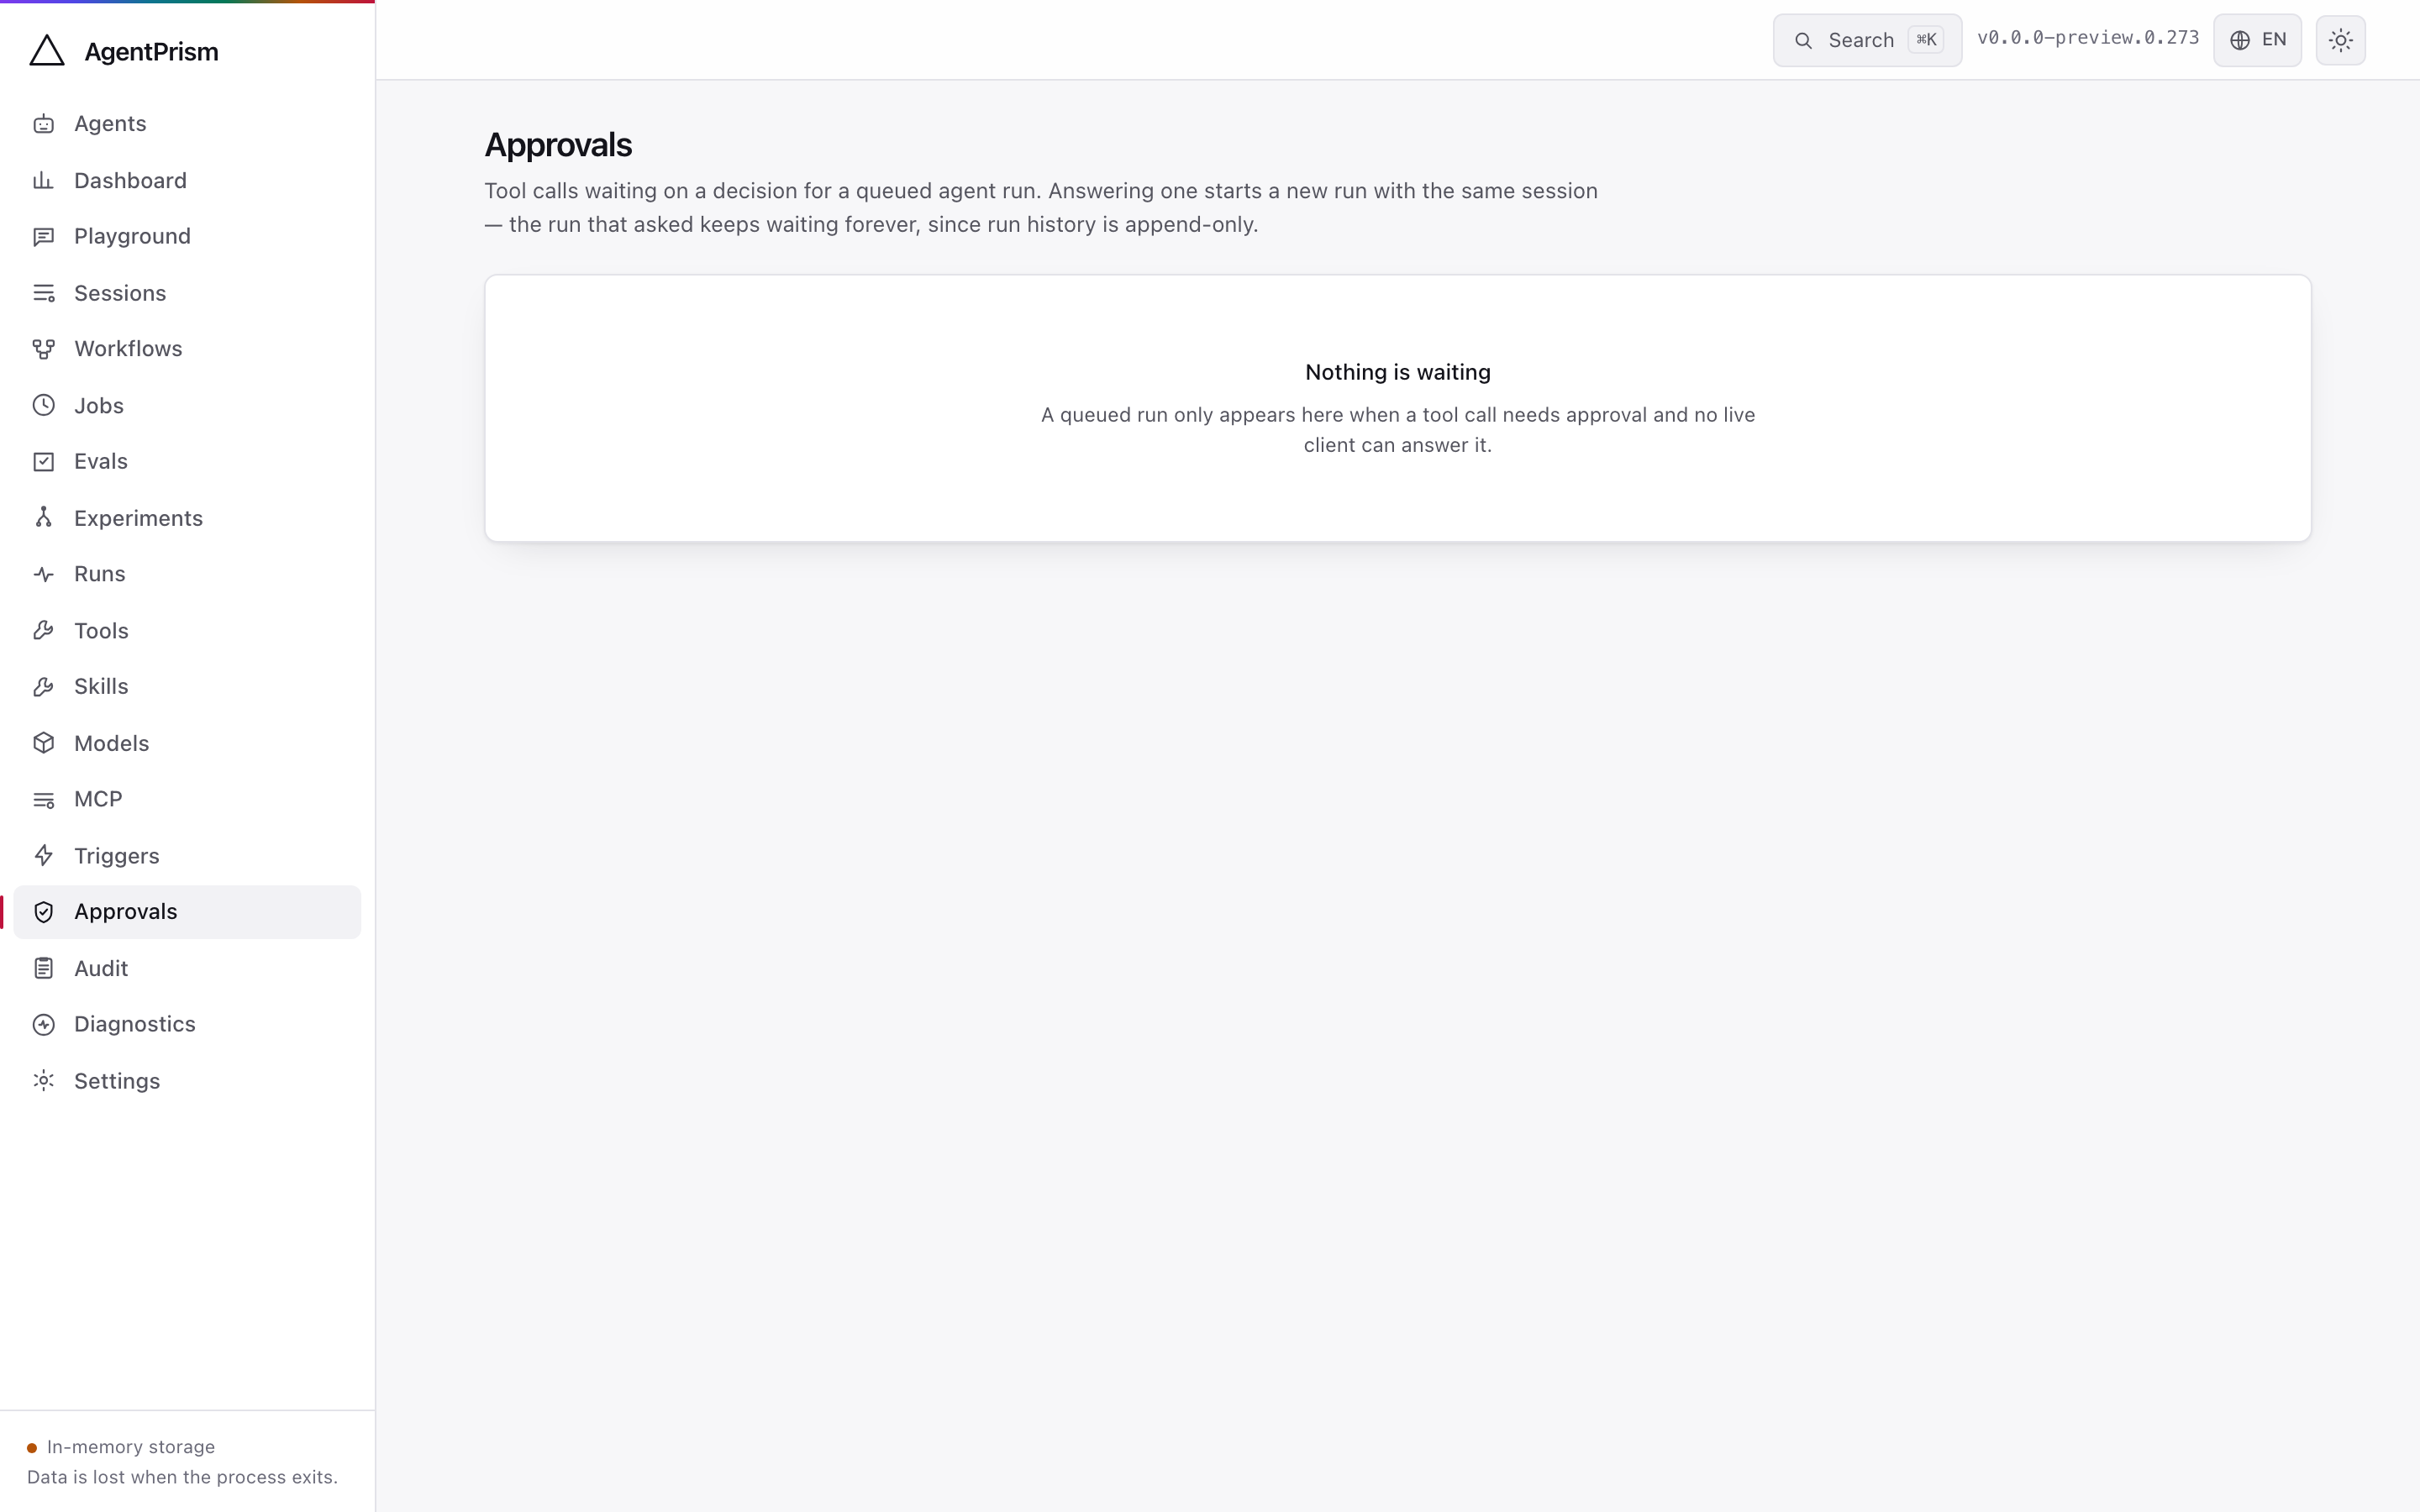
Tool calls waiting on a human, with the arguments as they were recorded and an expiry. Approving or rejecting both resume the run — the model has to see a result or a refusal and carry on.
Standing “don’t ask again” rules live under Governance, where they can be reviewed,
revoked, or written by hand with an argument condition (for example amount <= 100)
instead of an exact-argument fingerprint. The condition editor is a closed set of
comparisons, not a free-text expression box.
Catalog
Section titled “Catalog”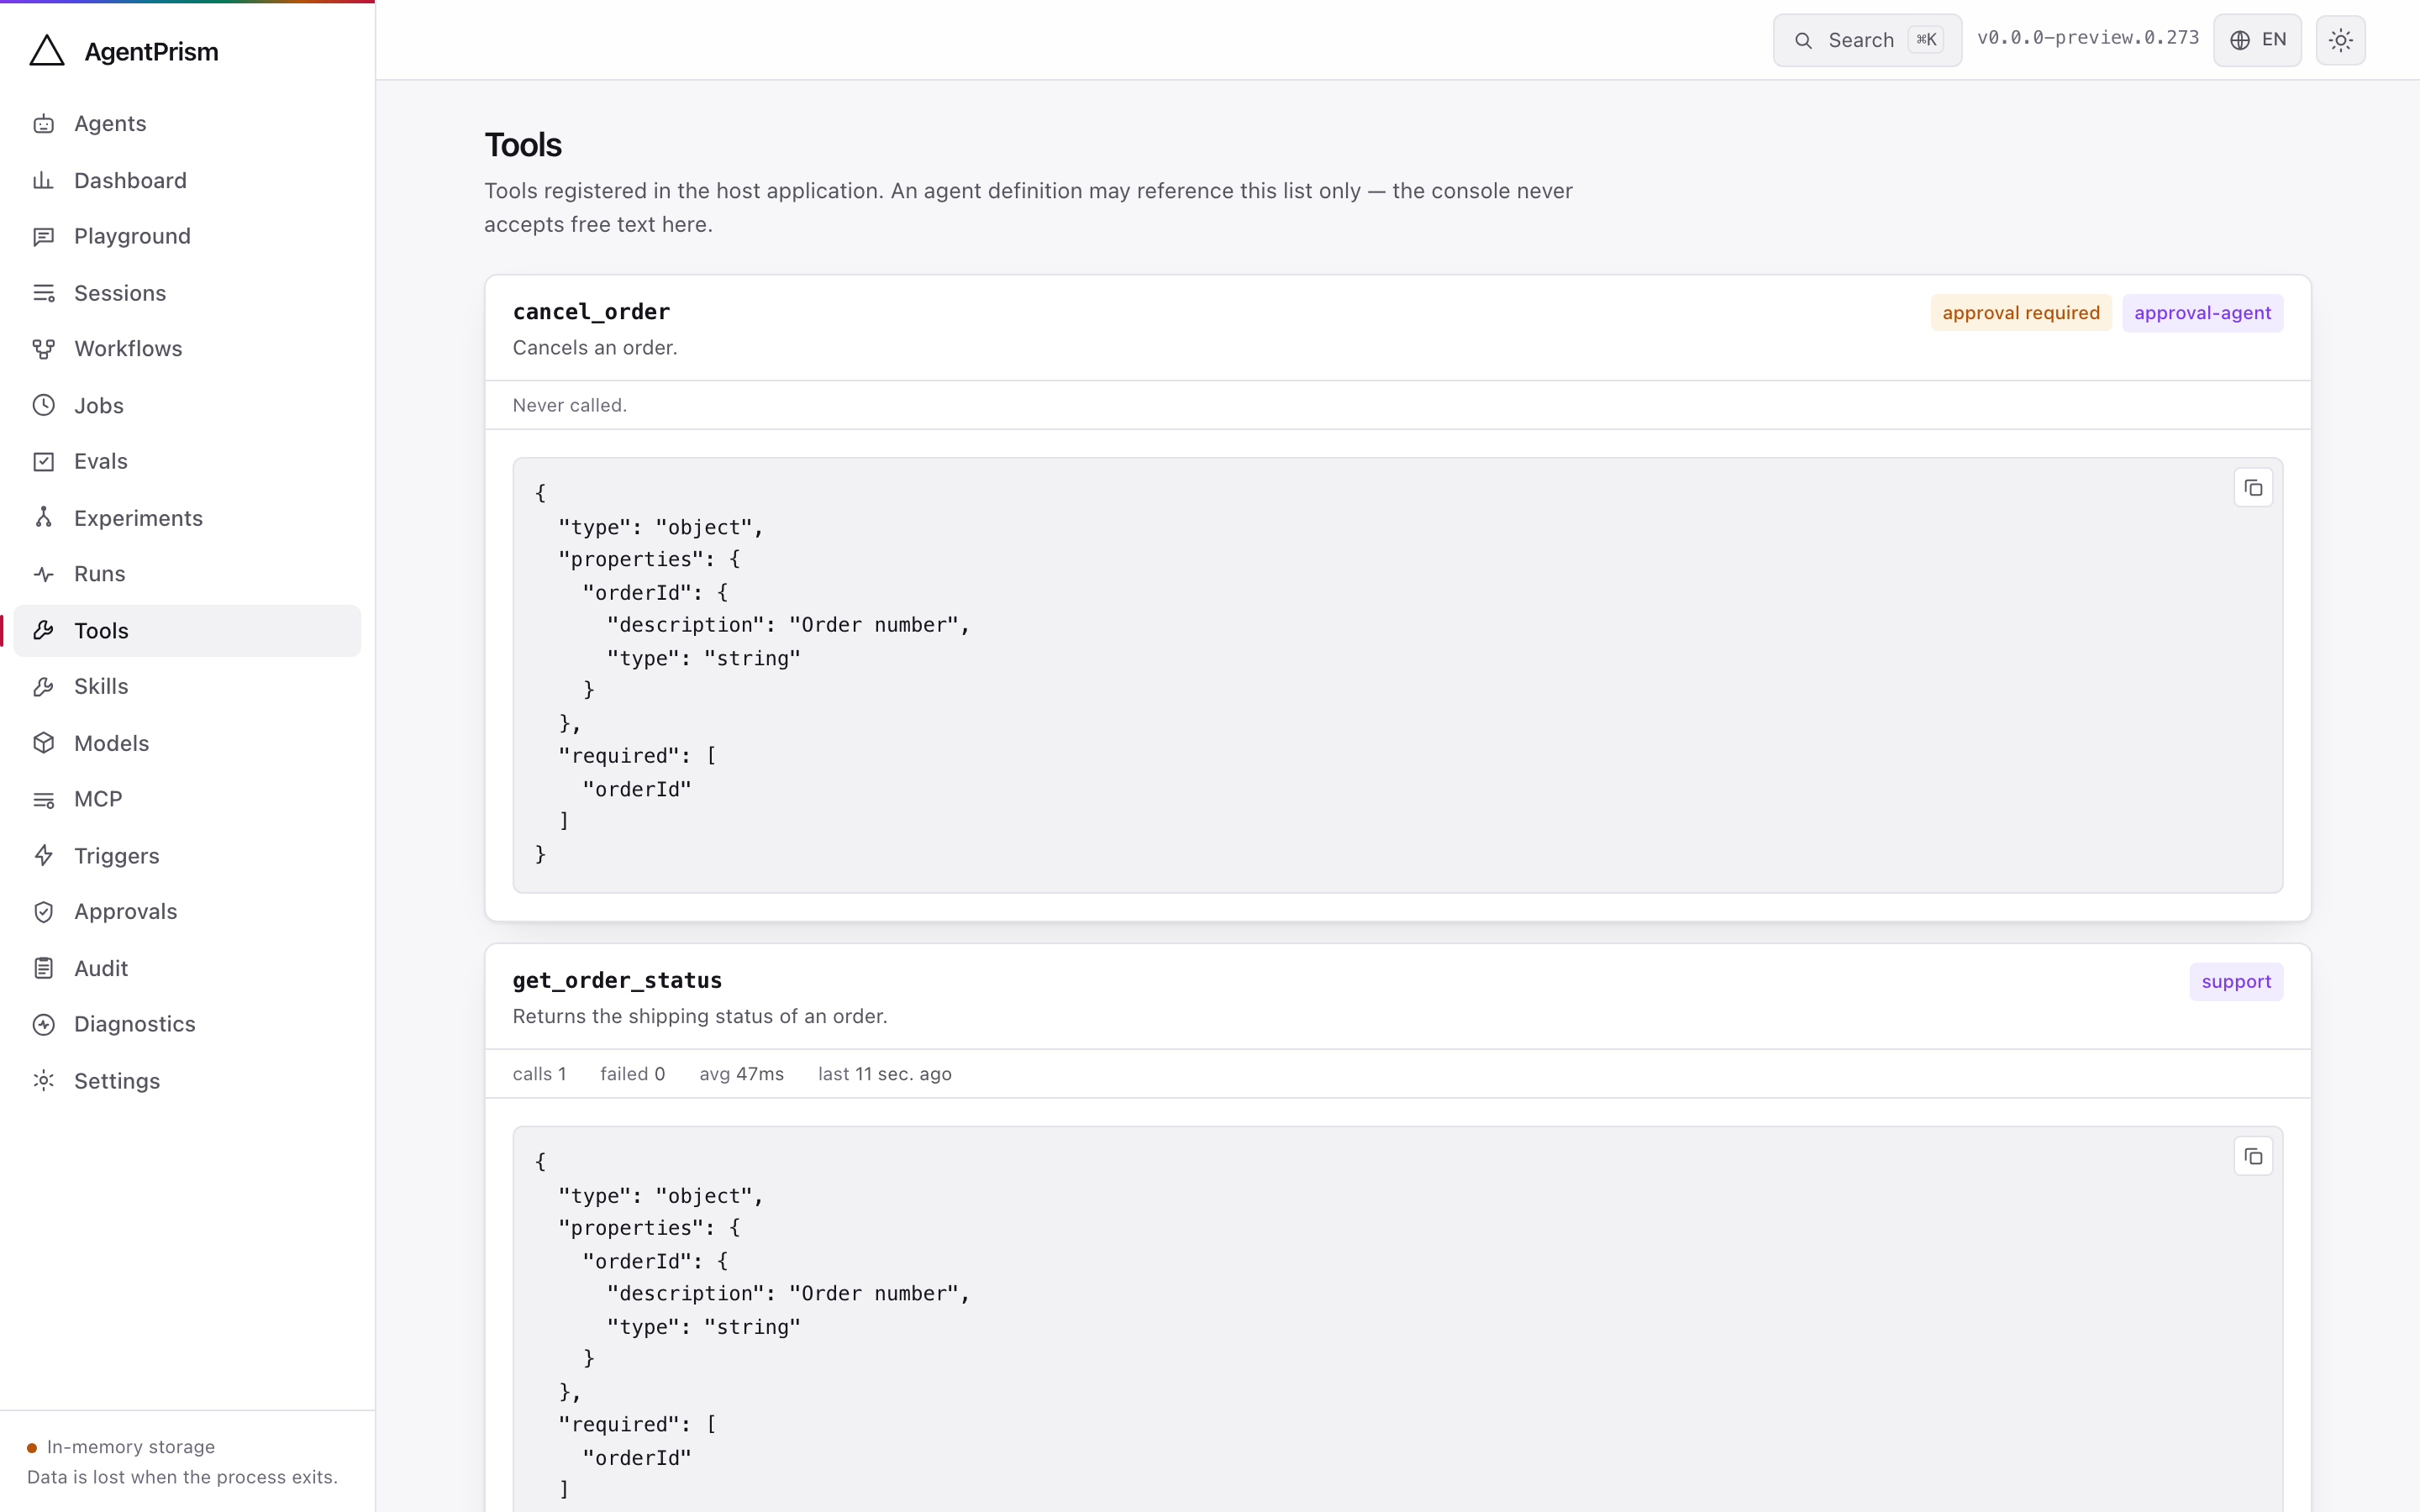
Tools with their generated JSON schemas — read-only, and permanently so. This screen
is where the code-only rule is most visible: you can see every tool an agent may use,
and there is no way to add one from here. A tool registered with AddClientTool(...)
carries a “client-side” badge: its declaration is still code-only, but its body runs
on the caller instead of the server. See
Client-side tools and the embeddable widget.
A destructive tool carries a red badge, one that sends data outside the process an
orange one, and a tool with a declared permission or a non-default timeout shows both
next to it — see Tools: authorization and timeout.
Skills
Section titled “Skills”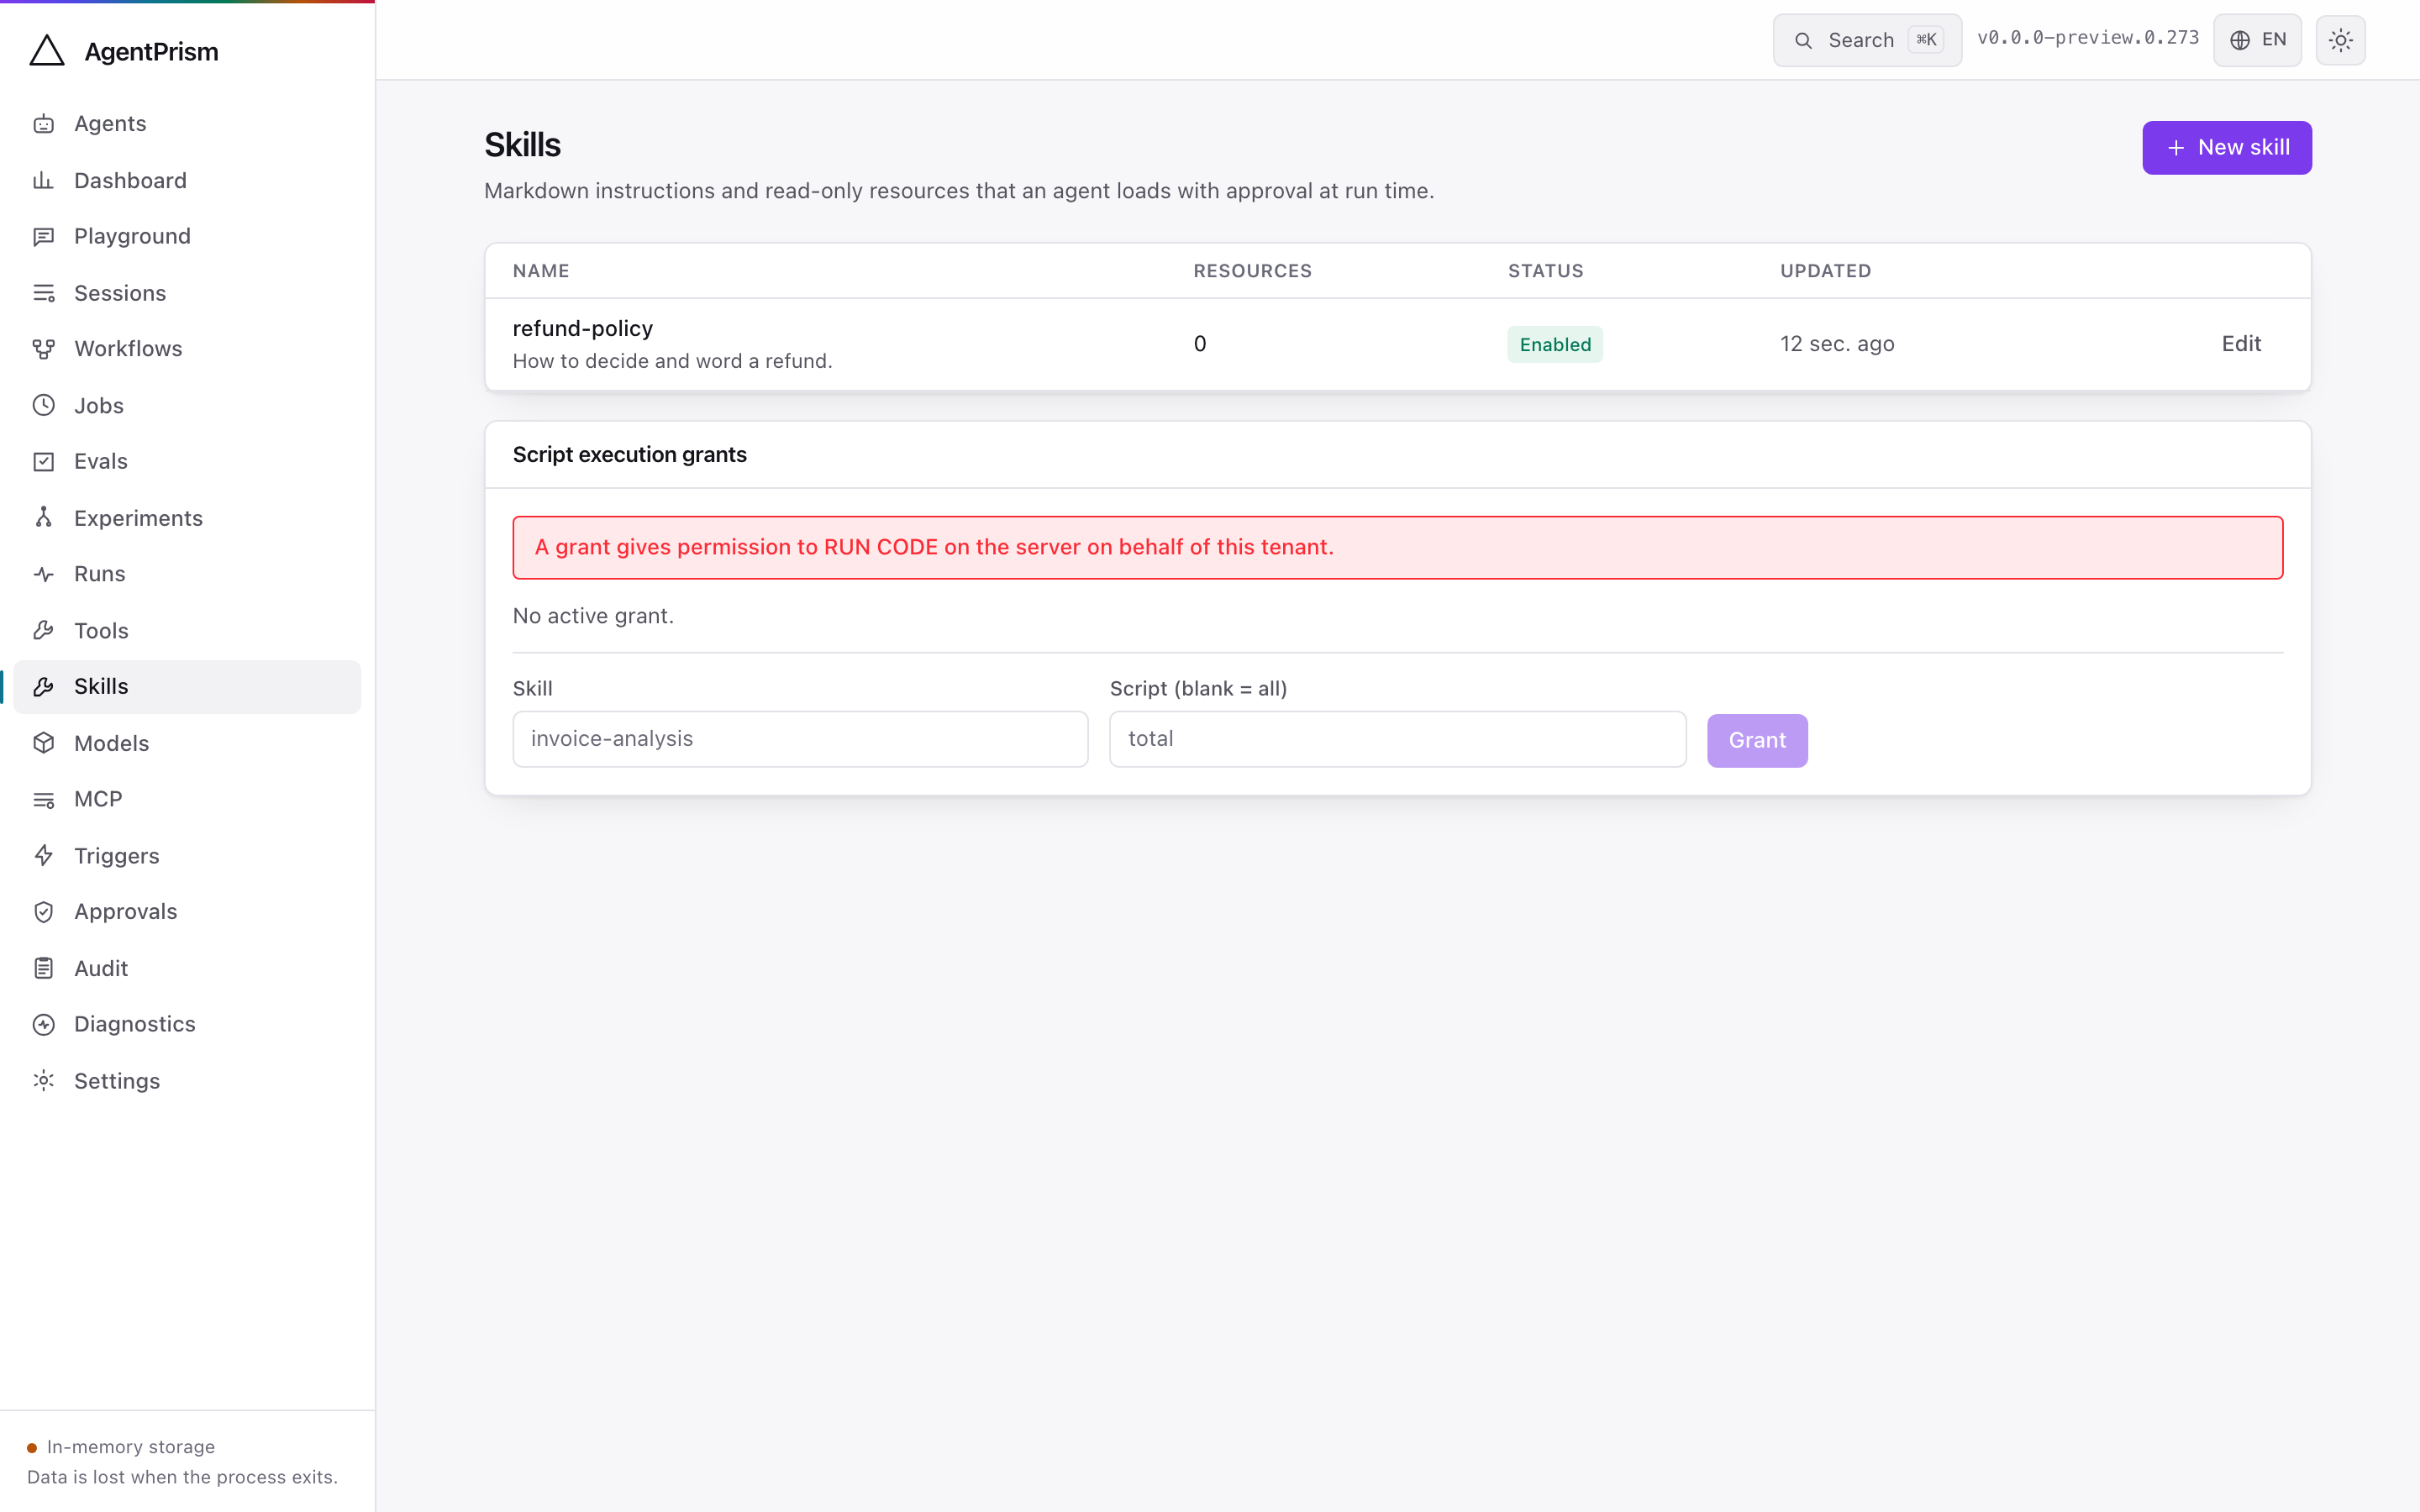
Skills sit beside the tools. A skill is markdown instructions plus read-only resources that an agent loads at run time, with approval. The editor shows the frontmatter, the compatibility and license fields, the allowed-tool list, and the resources; the markdown is stored as source text and the console does not render it.
This is the second place the code-only boundary is visible: a skill may carry a script, but the console can only reference a script the application already registered and granted. It cannot write one.
Models
Section titled “Models”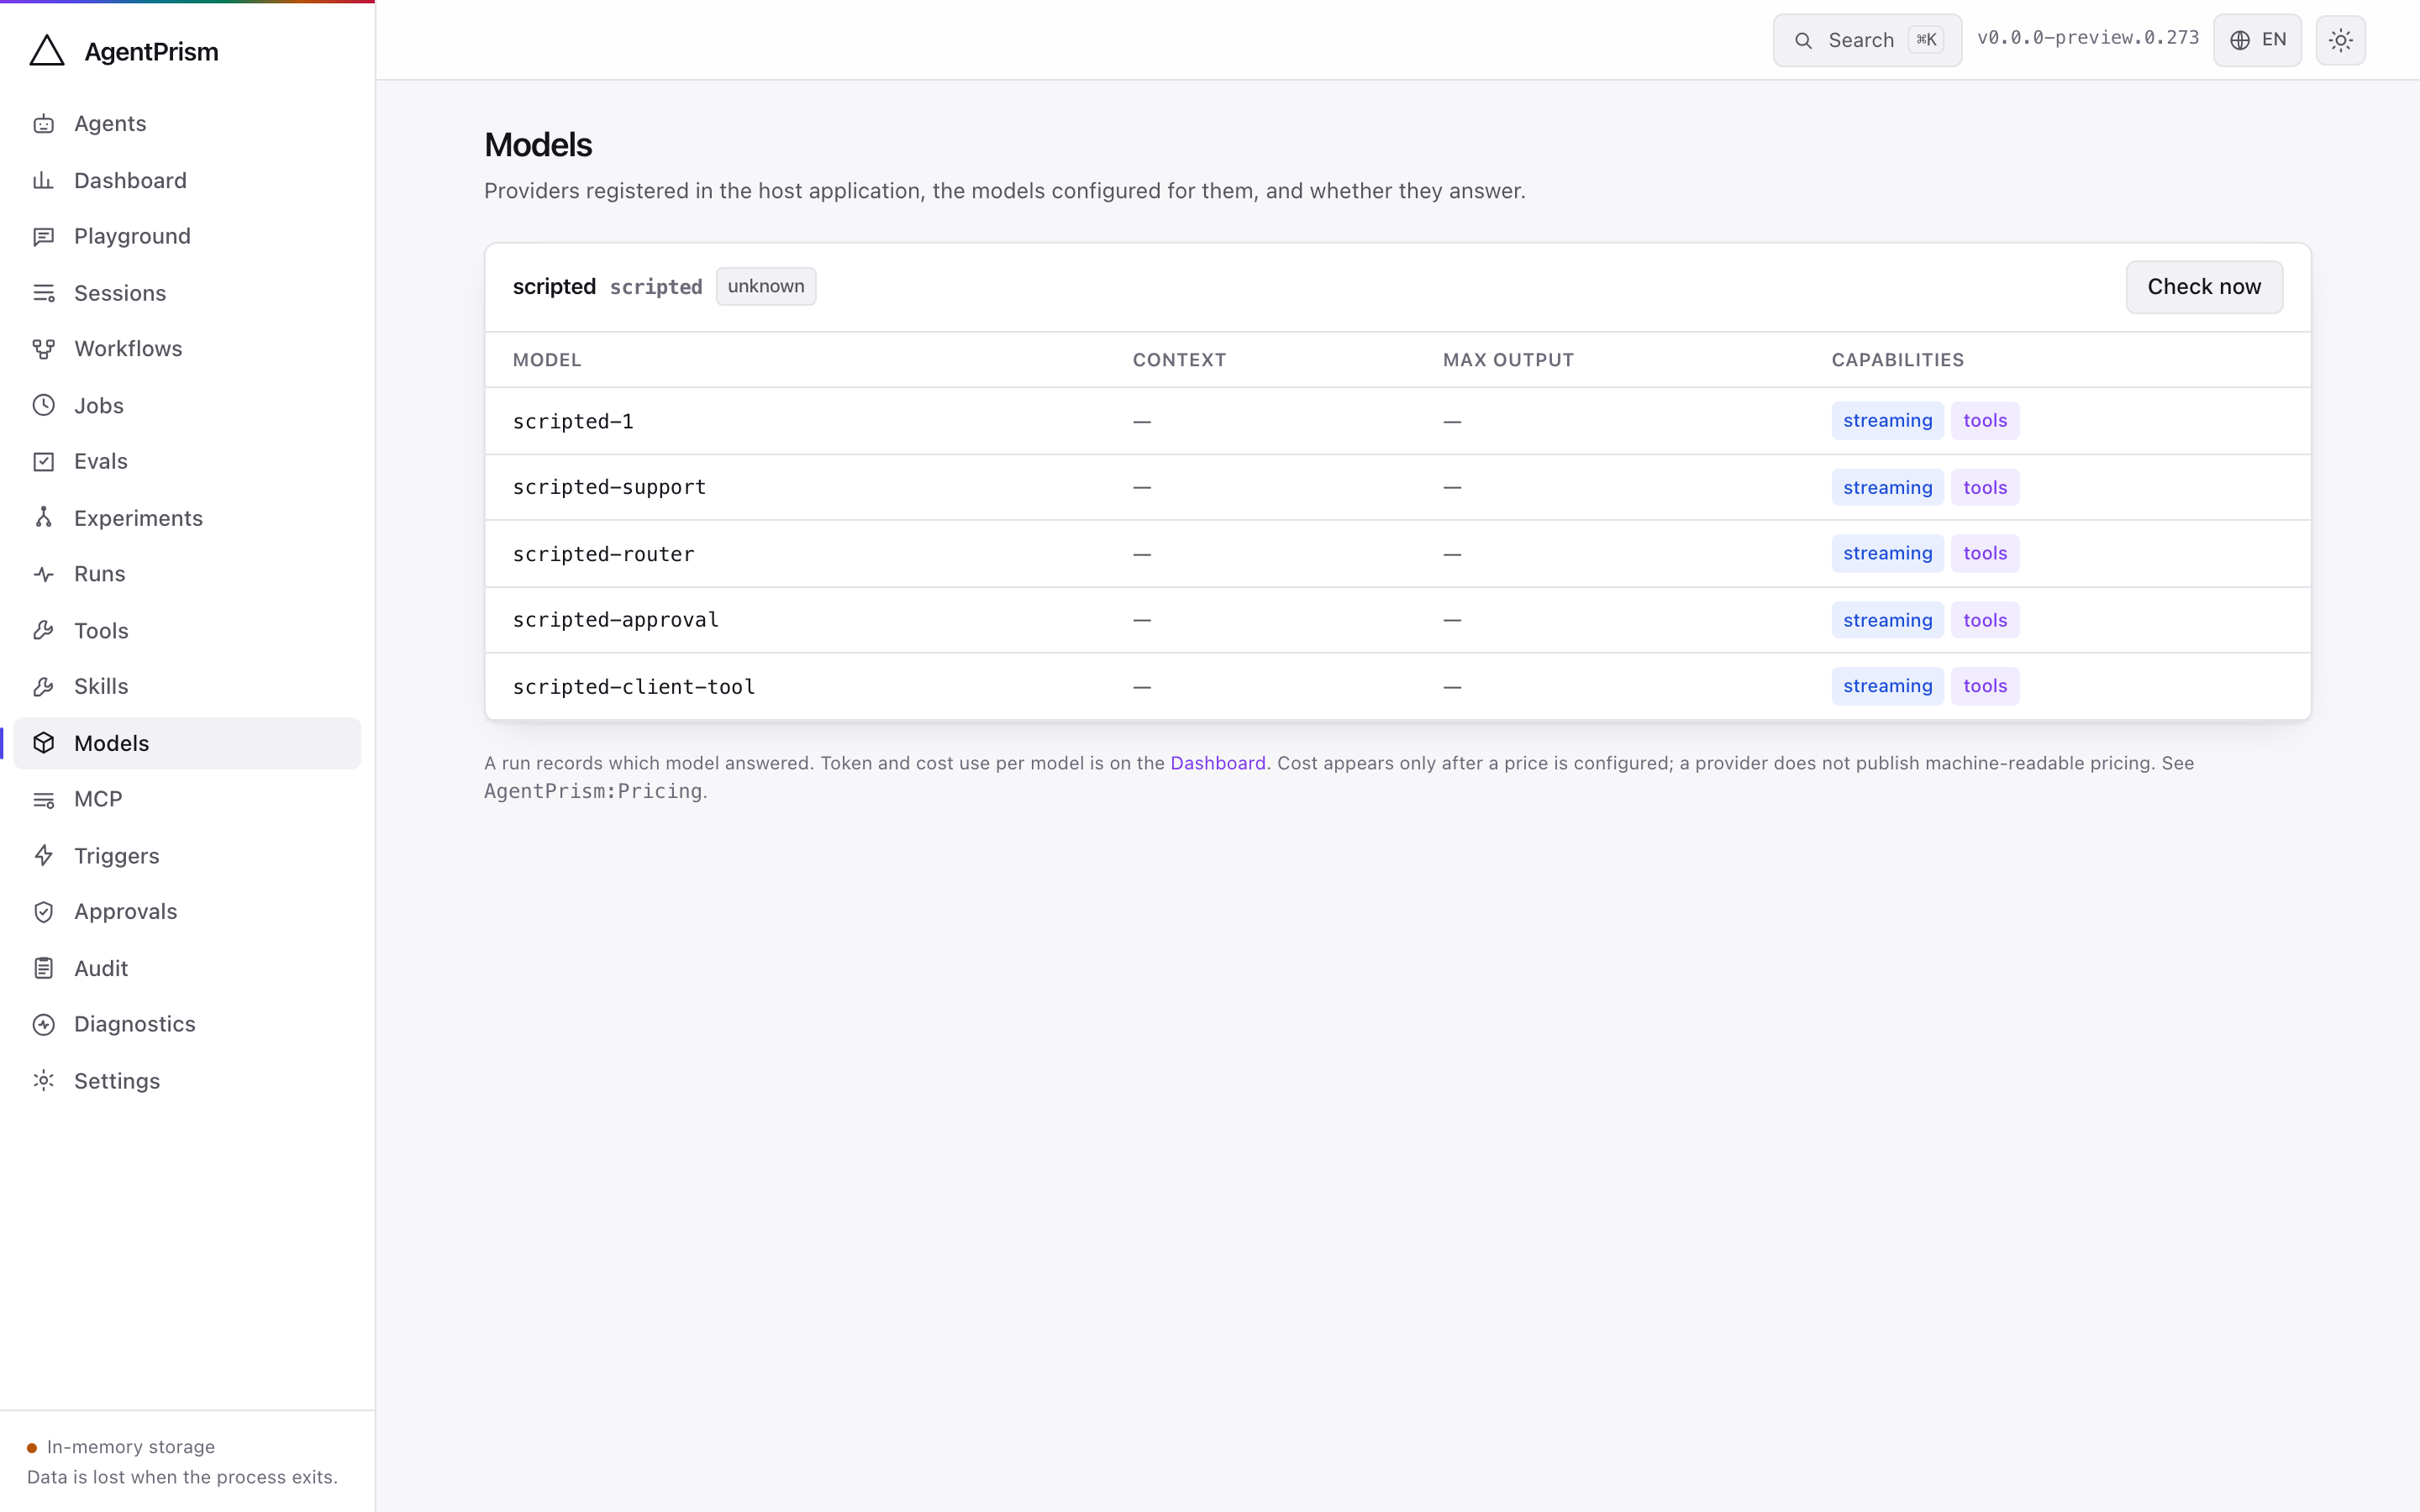
Providers and their configured models, with a health status served from cache.
A provider that implements no health check reports Unknown, which is not an error.
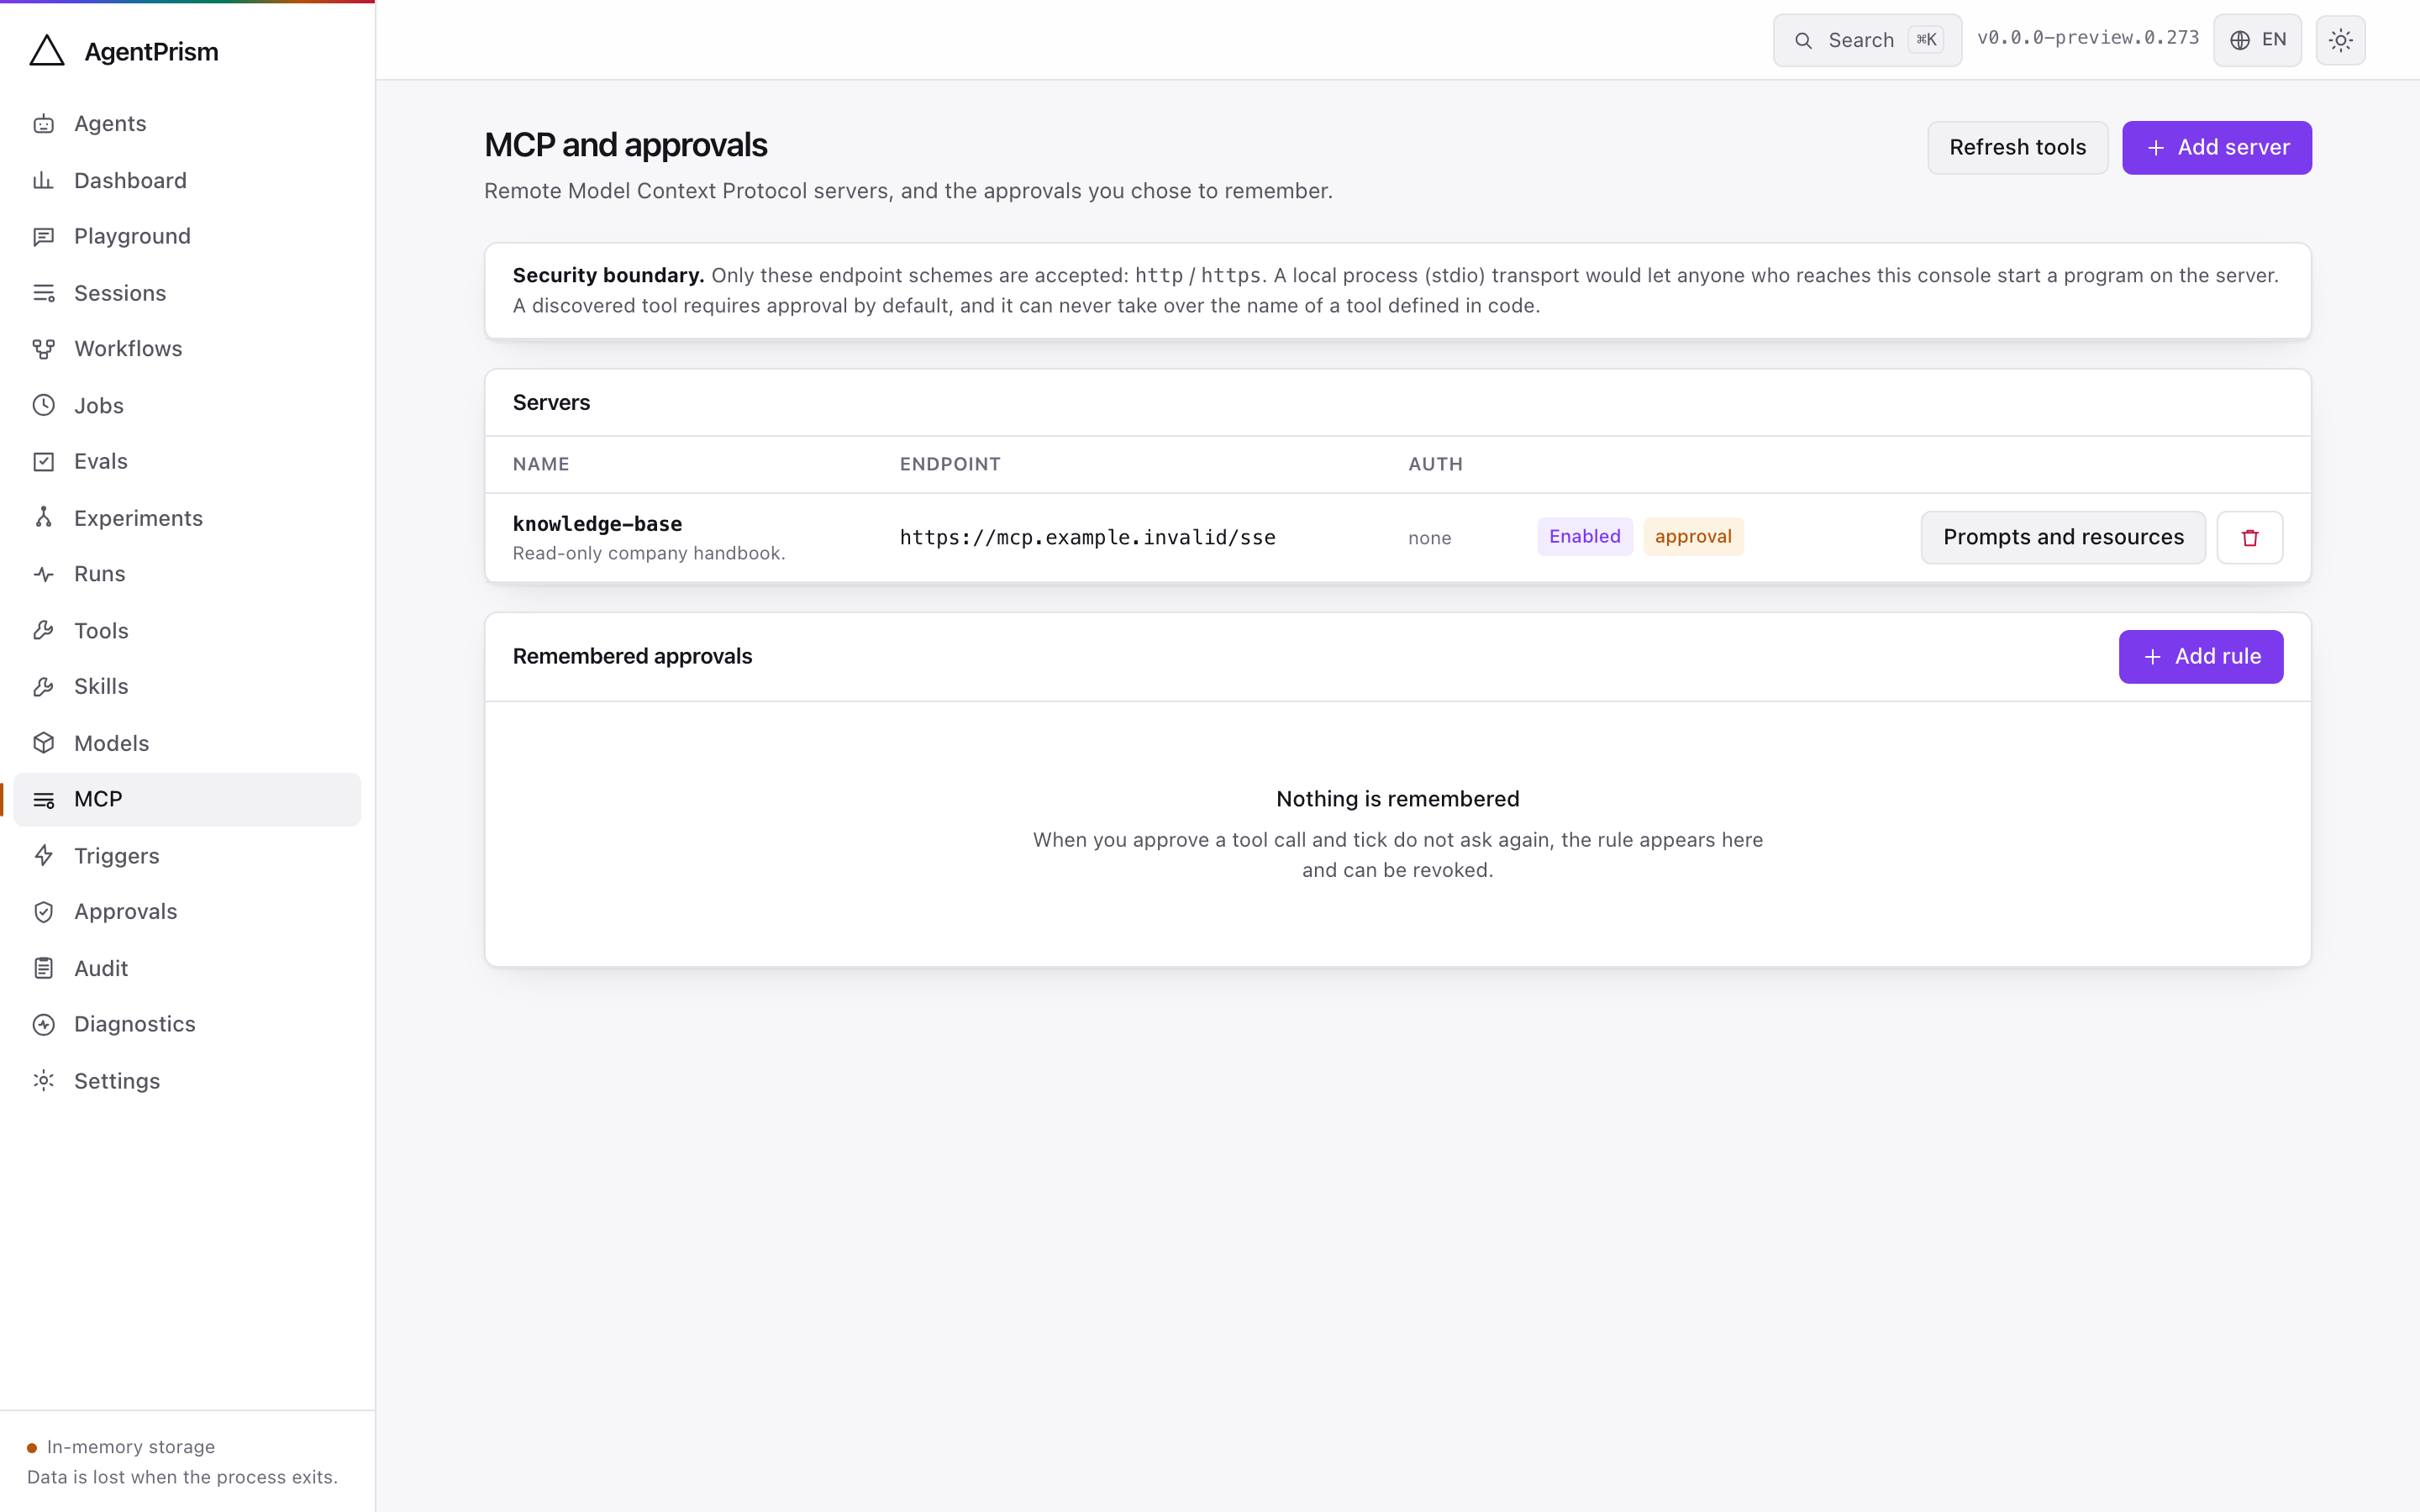
Remote MCP servers and the tools discovered from each. A server is a definition — an endpoint, a transport, and the name of the configuration key its authorization value is read from — so the console never holds a credential. Discovered tools carry the same approval badges as code-defined ones, and refreshing a server re-reads its catalog without a restart.
Governance
Section titled “Governance”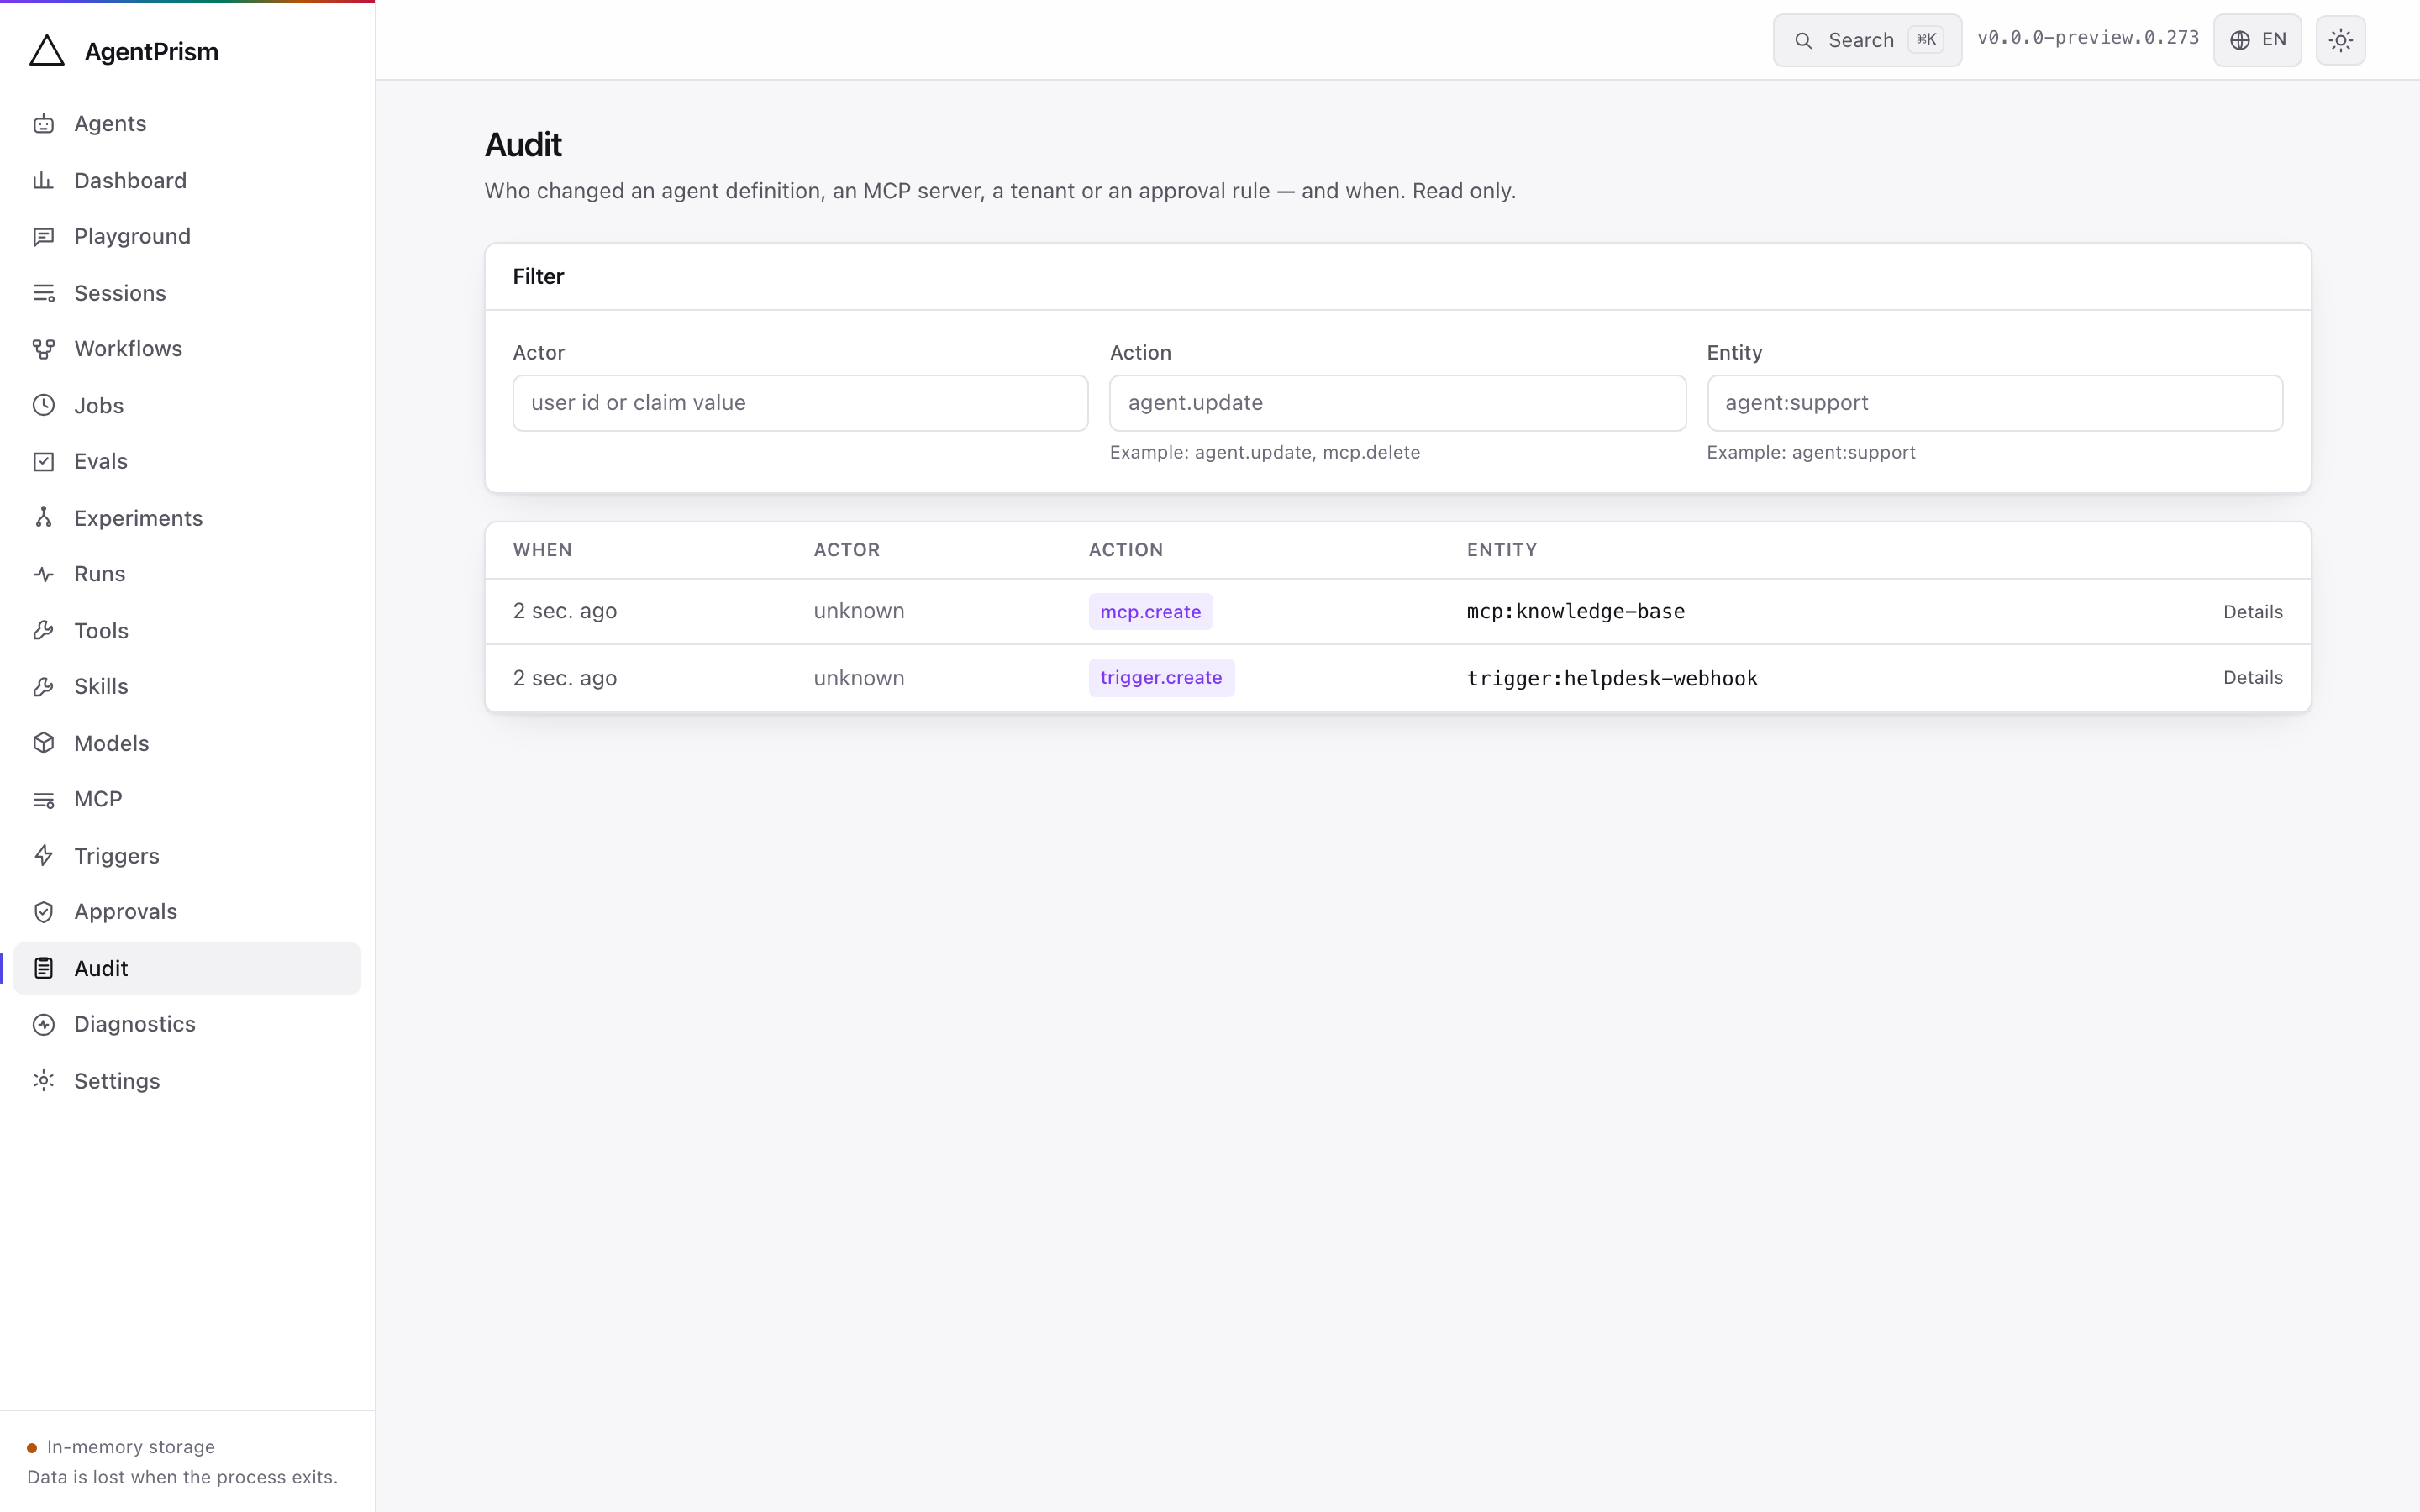
Who changed what, when, and from what to what — filterable by actor, action, entity, and date range. Secret-looking fields are masked before anything is stored.
Quotas, retention policies, API keys, tenants, tenant provider bindings and egress policy (BYOK), and skill script grants have their own screens in the same area.
Triggers
Section titled “Triggers”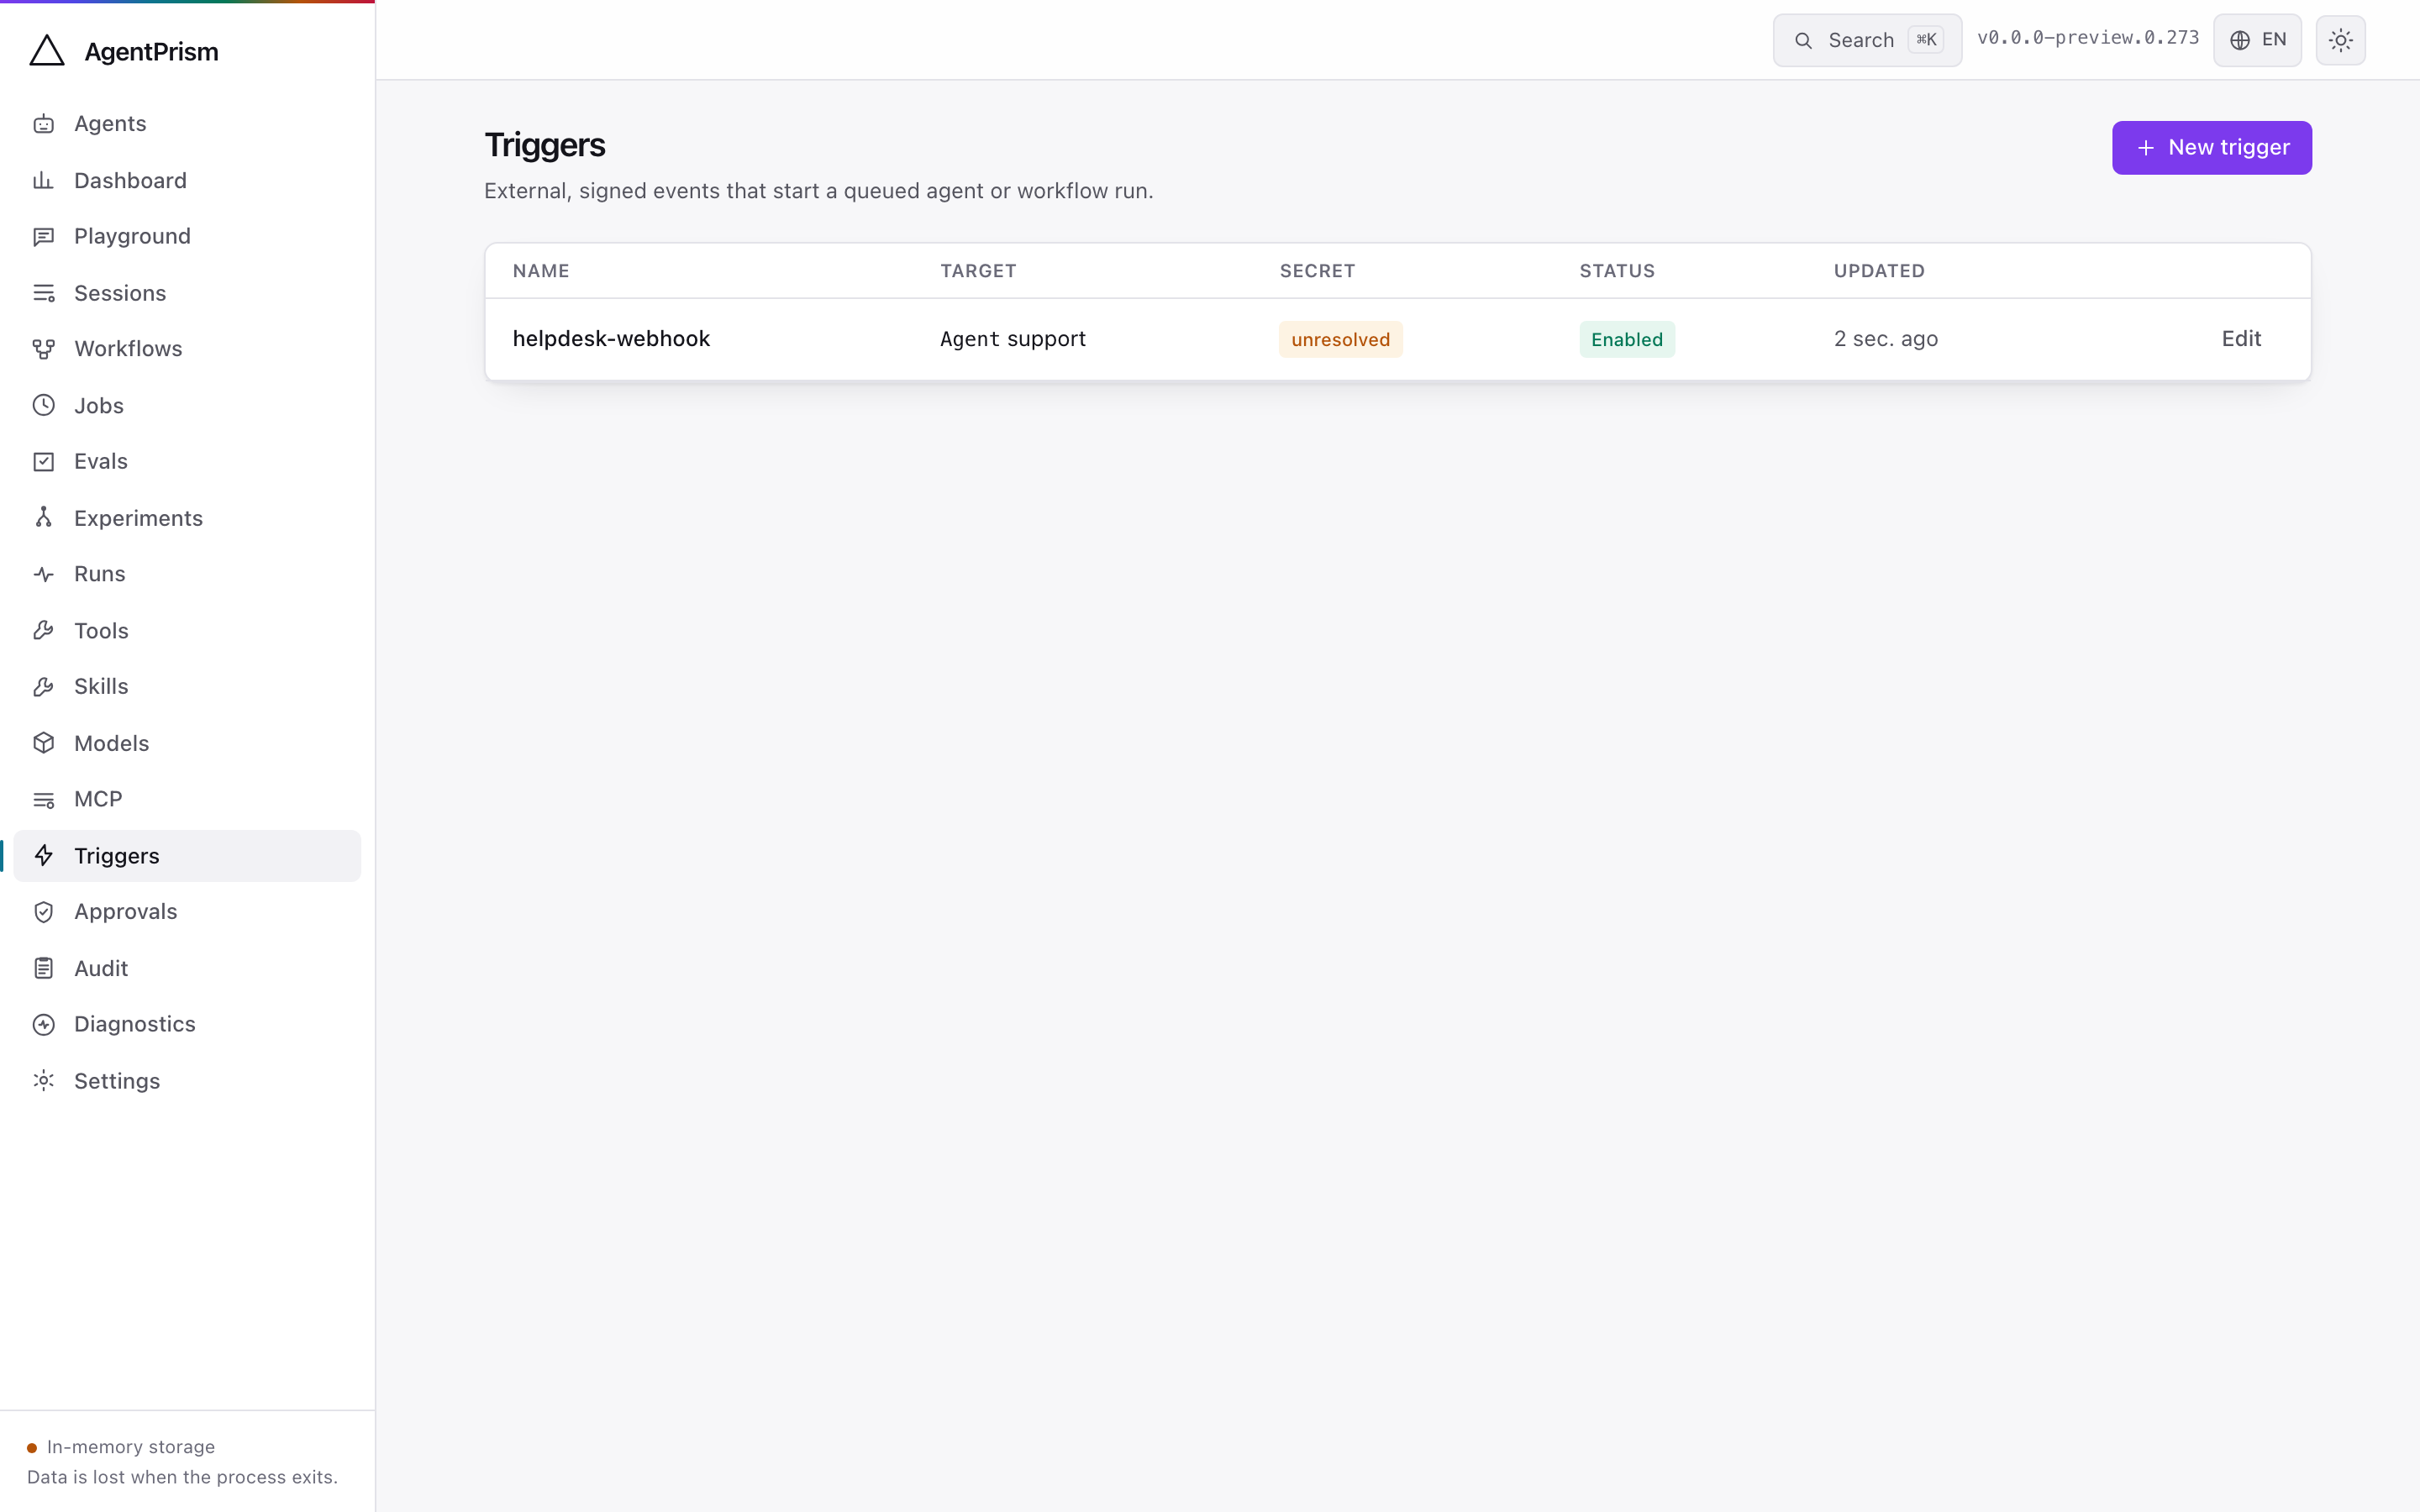
Inbound triggers let an external system start a queued run with one signed request and no API key. A trigger’s editor shows the exact URL to configure in that system, the target agent or workflow, and the name of the configuration key holding its signing secret — see Inbound triggers.
Diagnostics
Section titled “Diagnostics”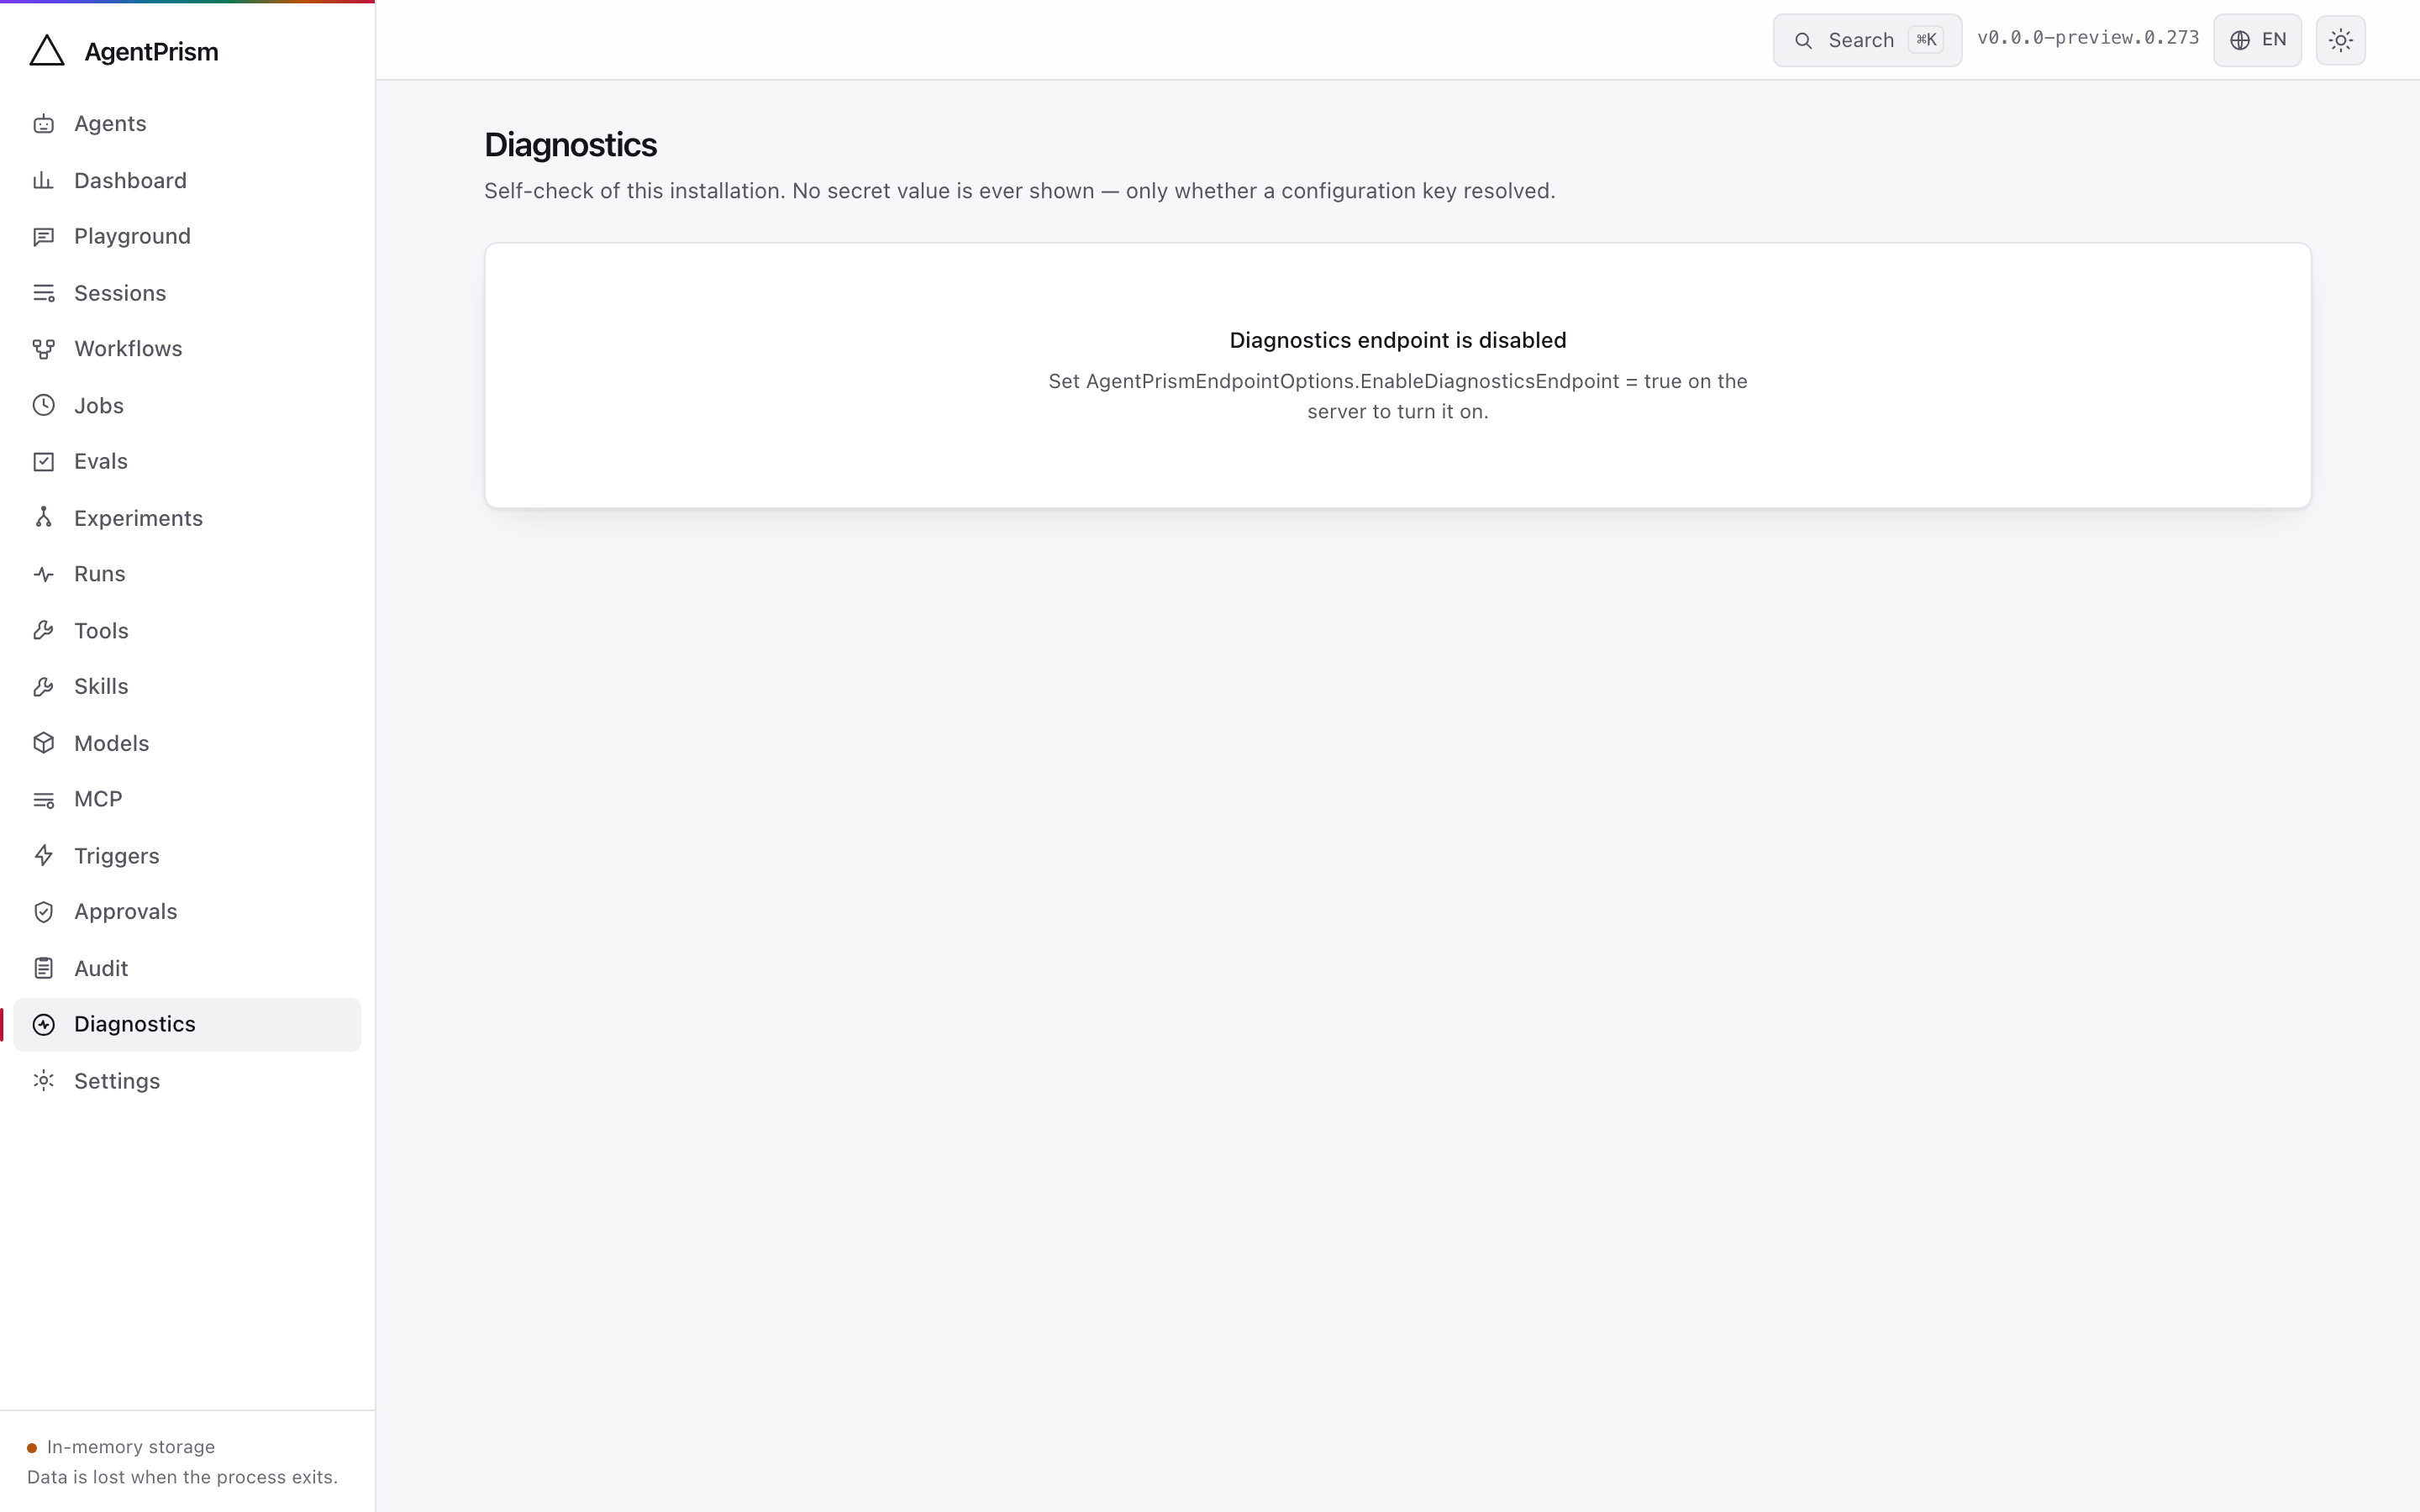
Diagnostics answers “is this deployment actually wired up the way I think”: which stores are active, whether migrations are up to date, and what is pending.
It is opt-in because setup details are sensitive. Enable the Admin endpoint before the screen can load it:
app.MapAgentPrism("/agentprism", options =>{ options.EnableDiagnosticsEndpoint = true;});Settings
Section titled “Settings”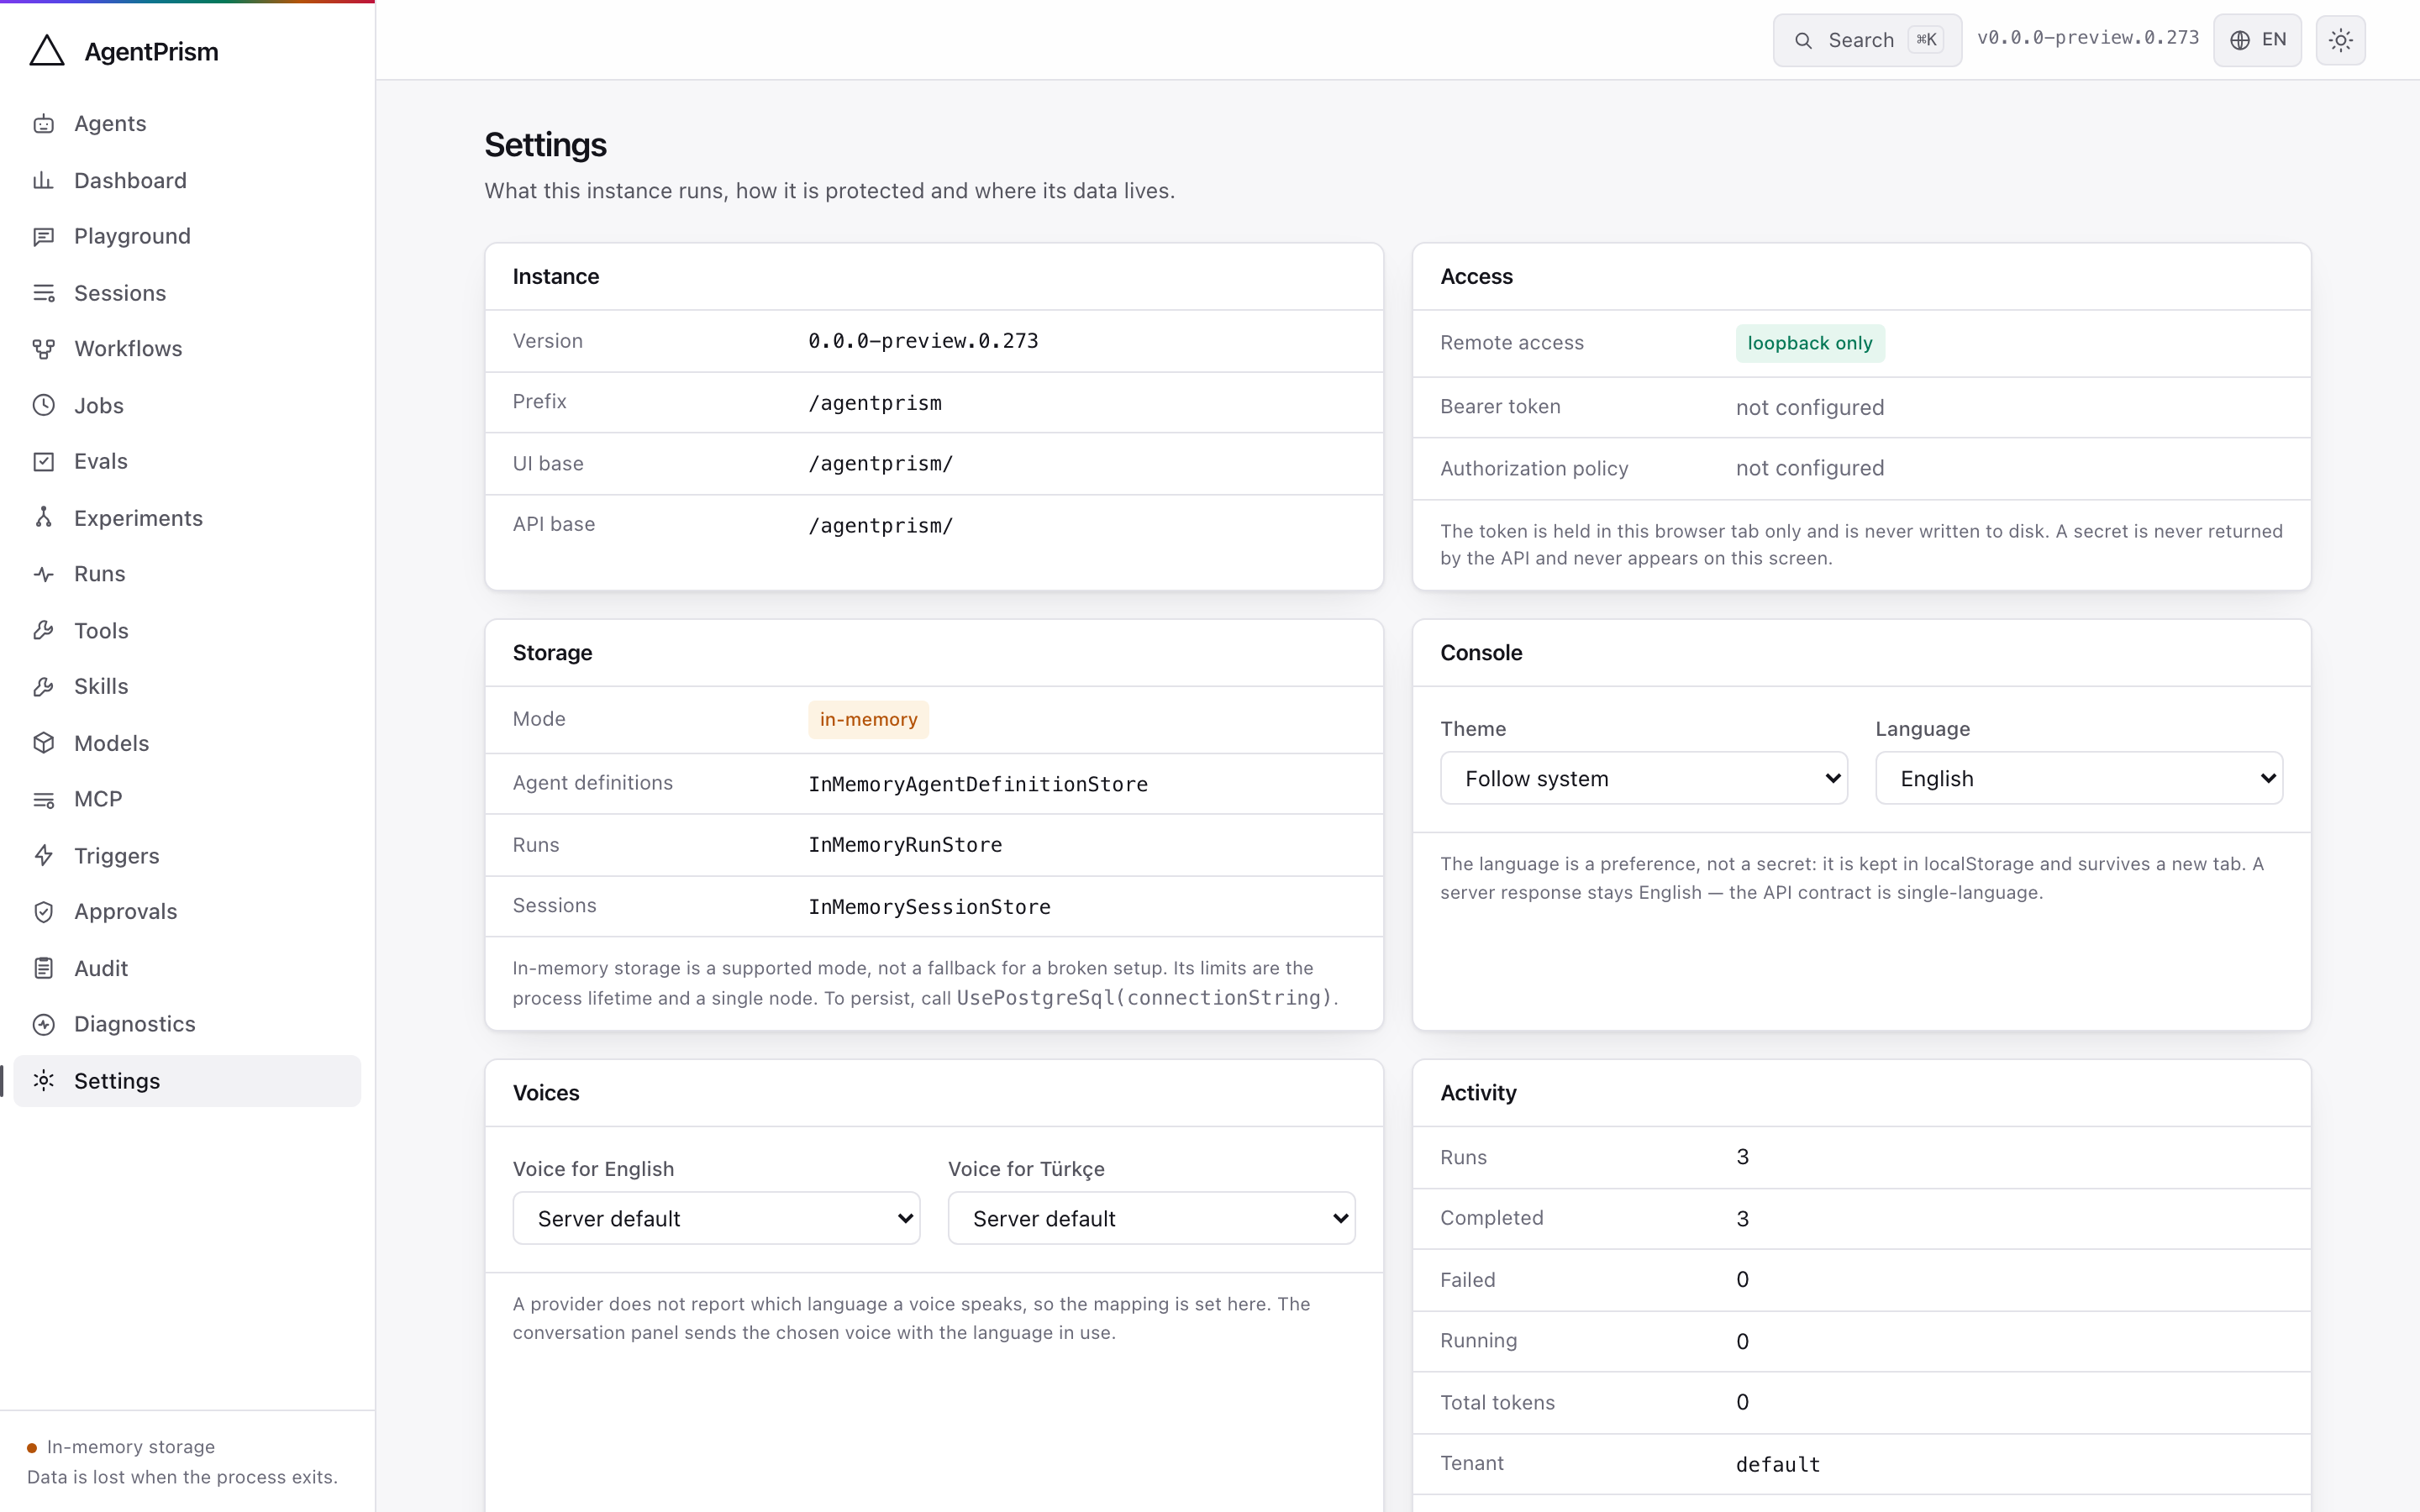
Version, prefix, authentication method, active stores, theme, and language.
Embeddable chat widget
Section titled “Embeddable chat widget”AgentPrism.UI also builds a second, much smaller bundle: a floating chat widget
meant for a different page — your own product’s site, not the console. It ships
from a separate Vite entry, with its own budget gate (30 KB gzip; current size:
2.7 KB), so console code cannot leak into it. UseUI() serves both; no separate
registration is needed.
<script src="https://your-agentprism-host/agentprism/embed/embed.js" data-server="https://your-agentprism-host" data-agent="support" data-api-key="sk_..."></script>The widget calls the run endpoint directly from the embedding page’s origin, so
AllowedOrigins must list that origin —
empty by default, so a page you have not explicitly allowed is blocked by the
browser. See
Client-side tools and the embeddable widget
for the full walkthrough, including how the widget runs a client-side tool.
Things worth knowing
Section titled “Things worth knowing”- The console works under any prefix and learns it at run time
- Light and dark themes; the default follows the operating system
- English and Turkish; the default follows the browser. Server messages are shown as they are and never translated — the same failure has to read the same way in a log, a test, and a support ticket
- A command palette on
⌘K/Ctrl+K - Buttons the caller has no role for are hidden, based on what
/api/metareports - The token is kept in
sessionStorageand is gone when the tab closes; theme and language live inlocalStorage - The JavaScript budget is 250 KB gzip and is enforced by the build. Current size: 169.4 KB
Editor boundaries
Section titled “Editor boundaries”The editor supports structured output, harness settings, and compaction. Three newer
definition areas are code/HTTP-only today: provider-specific ProviderSettings,
static McpResourceUris, and Knowledge vector bindings. Do not round-trip a
definition that uses those fields through the current editor; edit it through code or
the management HTTP API so the fields remain explicit.
Read next
Section titled “Read next”- Securing the endpoints — why the shell is exempt from the bearer layer
- The HTTP API — everything the console does, as requests
- Client-side tools and the embeddable widget — a tool whose body runs in the browser, and the chat widget that runs it